Geospatial Information with the Elastic Stack
The Elastic Stack is an open source foundation that offers data solutions from any source and any format. Digitalisation is just the start of exciting data exploration. We start our journey with geospatial information.
Elastic and Geo
The heart of the Elastic Stack is Elasticsearch. From the official site:
Elasticsearch is a distributed, RESTful search and analytics engine capable of solving a growing number of use cases. As the heart of the Elastic Stack, it centrally stores your data so you can discover the expected and uncover the unexpected.
With this post, we introduce the geospatial capabilities of Elasticsearch and how to visualise it with Coordinate Maps in Kibana.
Elasticsearch provides numerous data types. In the area of geolocation, the data type geo_point is the right choice.
A geo point consists of two information:
- latitude
- longitude
The following picture shows the latitude and longitude of the earth (Source: Wikimedia Commons)

Data Mapping and Ingestion
To retrieve geo points, we have to geocode information. Geocoding is the computational process of transforming a physical address description to a location.
For example, the Mimacom Group has several locations. To use geo points, we have explicitly defined them in our data mapping.
GET locations/_mapping
{
  "locations": {
    "mappings": {
      "doc": {
        "properties": {
          "address": {
            "type": "text"
          },
          "email": {
            "type": "keyword"
          },
          "id": {
            "type": "keyword"
          },
          "location": {
            "type": "geo_point"
          },
          "name": {
            "type": "keyword"
          },
          "phone": {
            "type": "text"
          }
        }
      }
    }
  }
}
After the geocoding, I imported the information to Elasticsearch. The following Kibana Discover view shows an excerpt of the data.
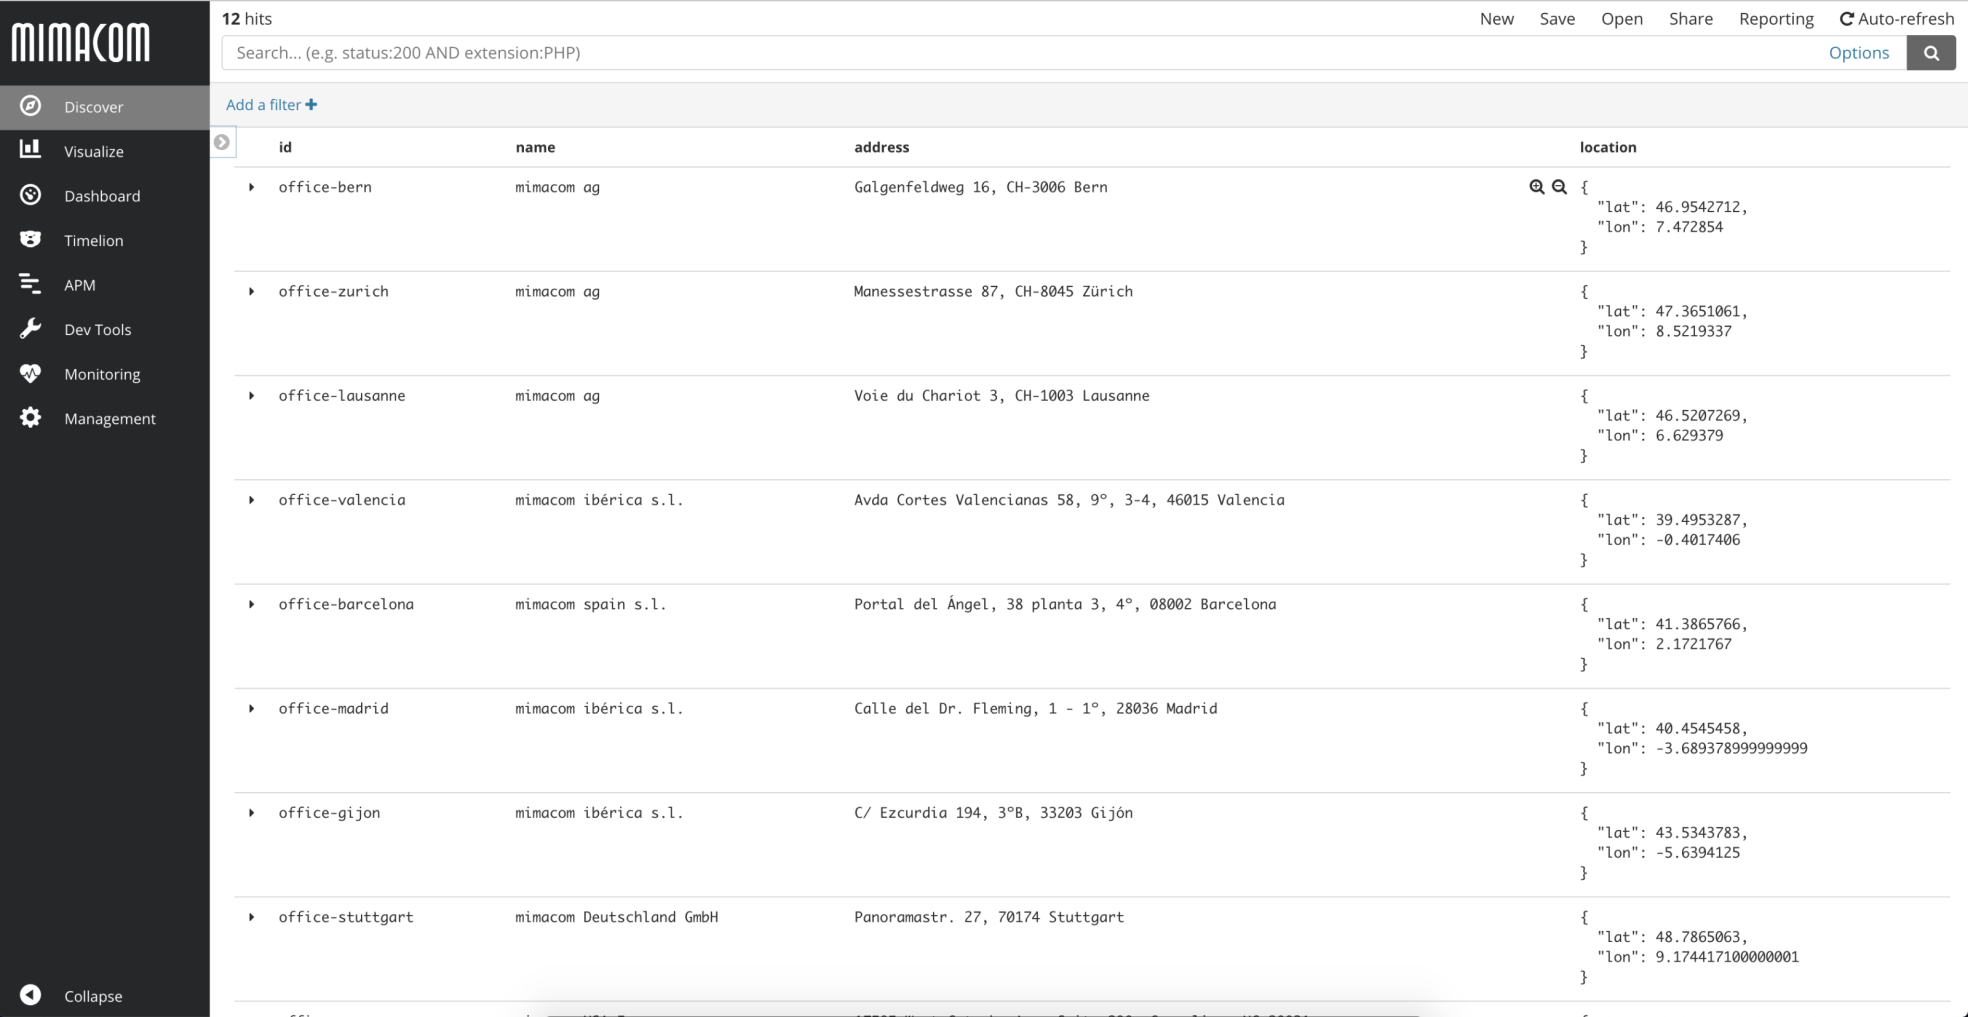
Elasticsearch uses the abbreviation lat and lon for latitude and longitude. An example for the location in Zurich.
{
    "id": "office-zurich",
    "name": "mimacom ag",
    "address": "Manessestrasse 87, CH-8045 Zürich",
    "phone": "+41 43 501 09 00",
    "email": "info@mimacom.com",
    "location": {
      "lat": 47.3651061,
      "lon": 8.5219337
    }
}
Kibana Coordinate Map
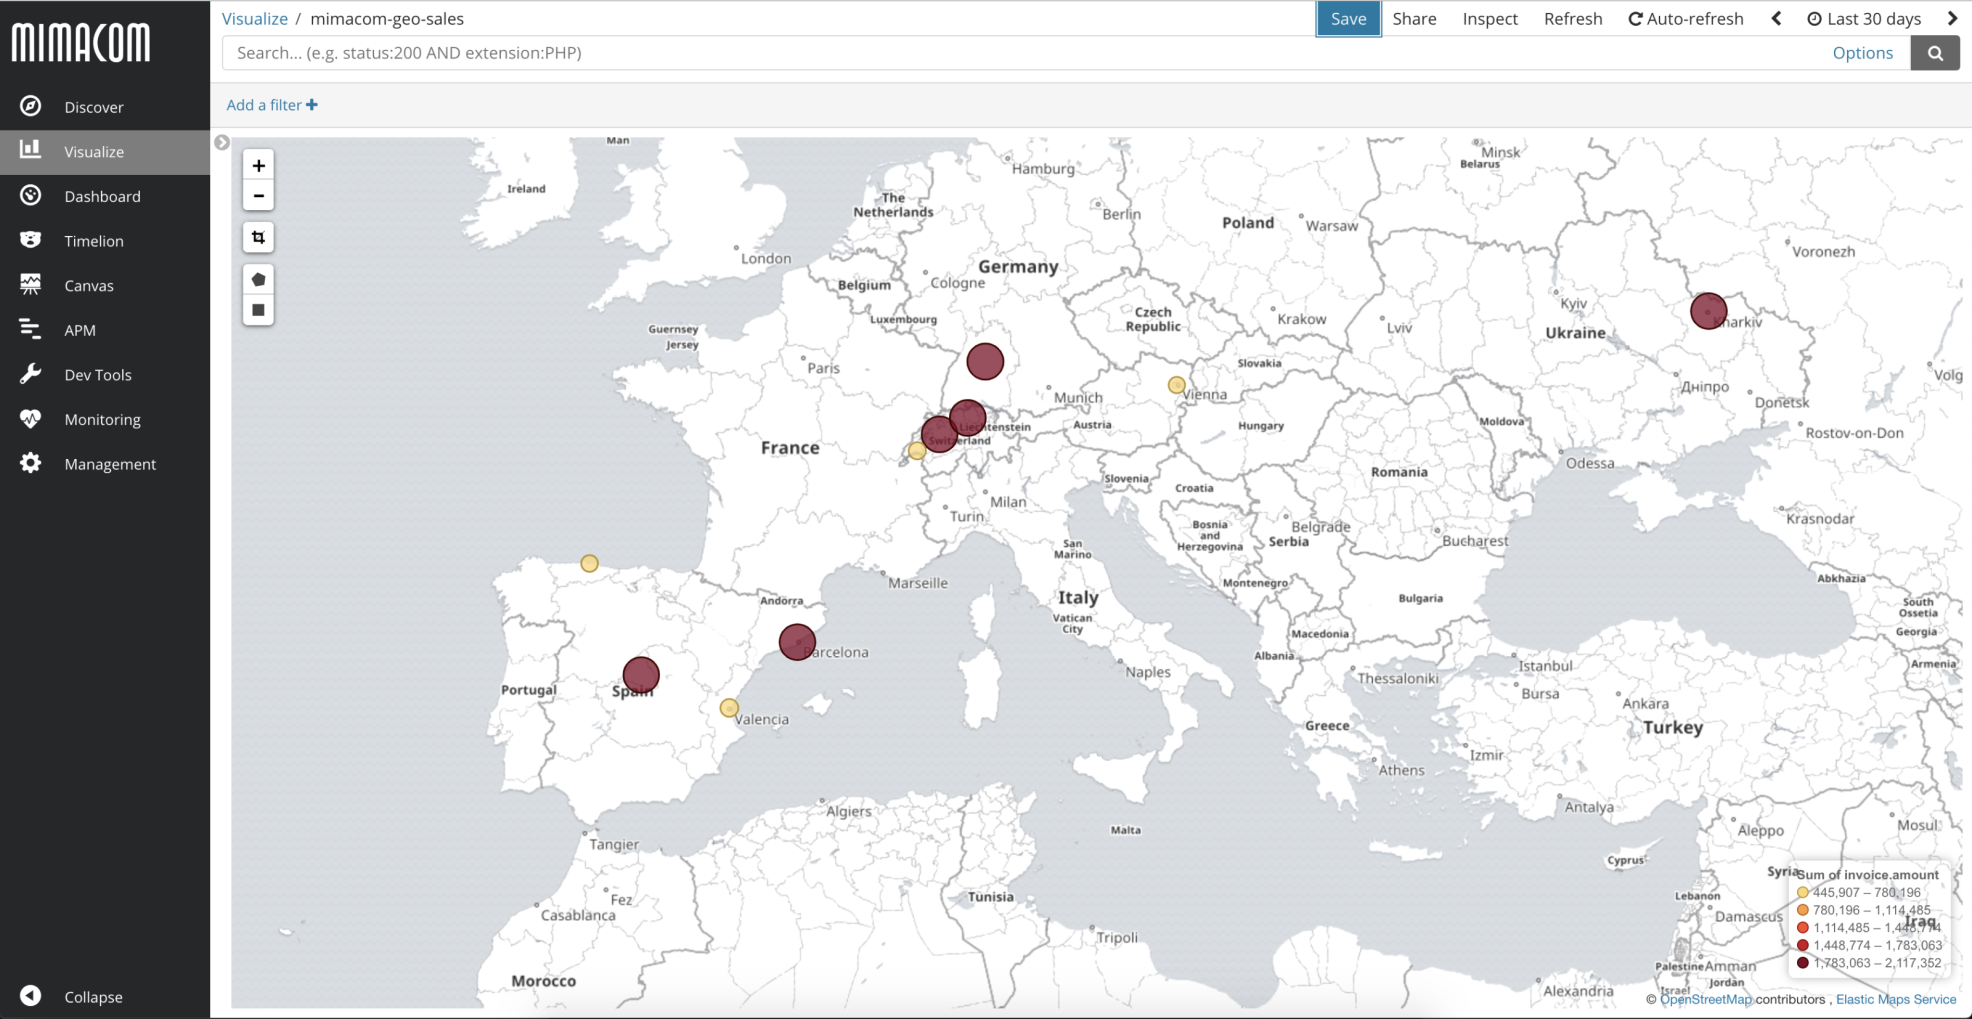
Kibana is the window to your Elasticsearch data. It offers a set of visualisation possibilities. For geo-information, we use the Kibana Coordinate Map visualisation. The following picture shows a complete world map with all locations of the mimacom group.
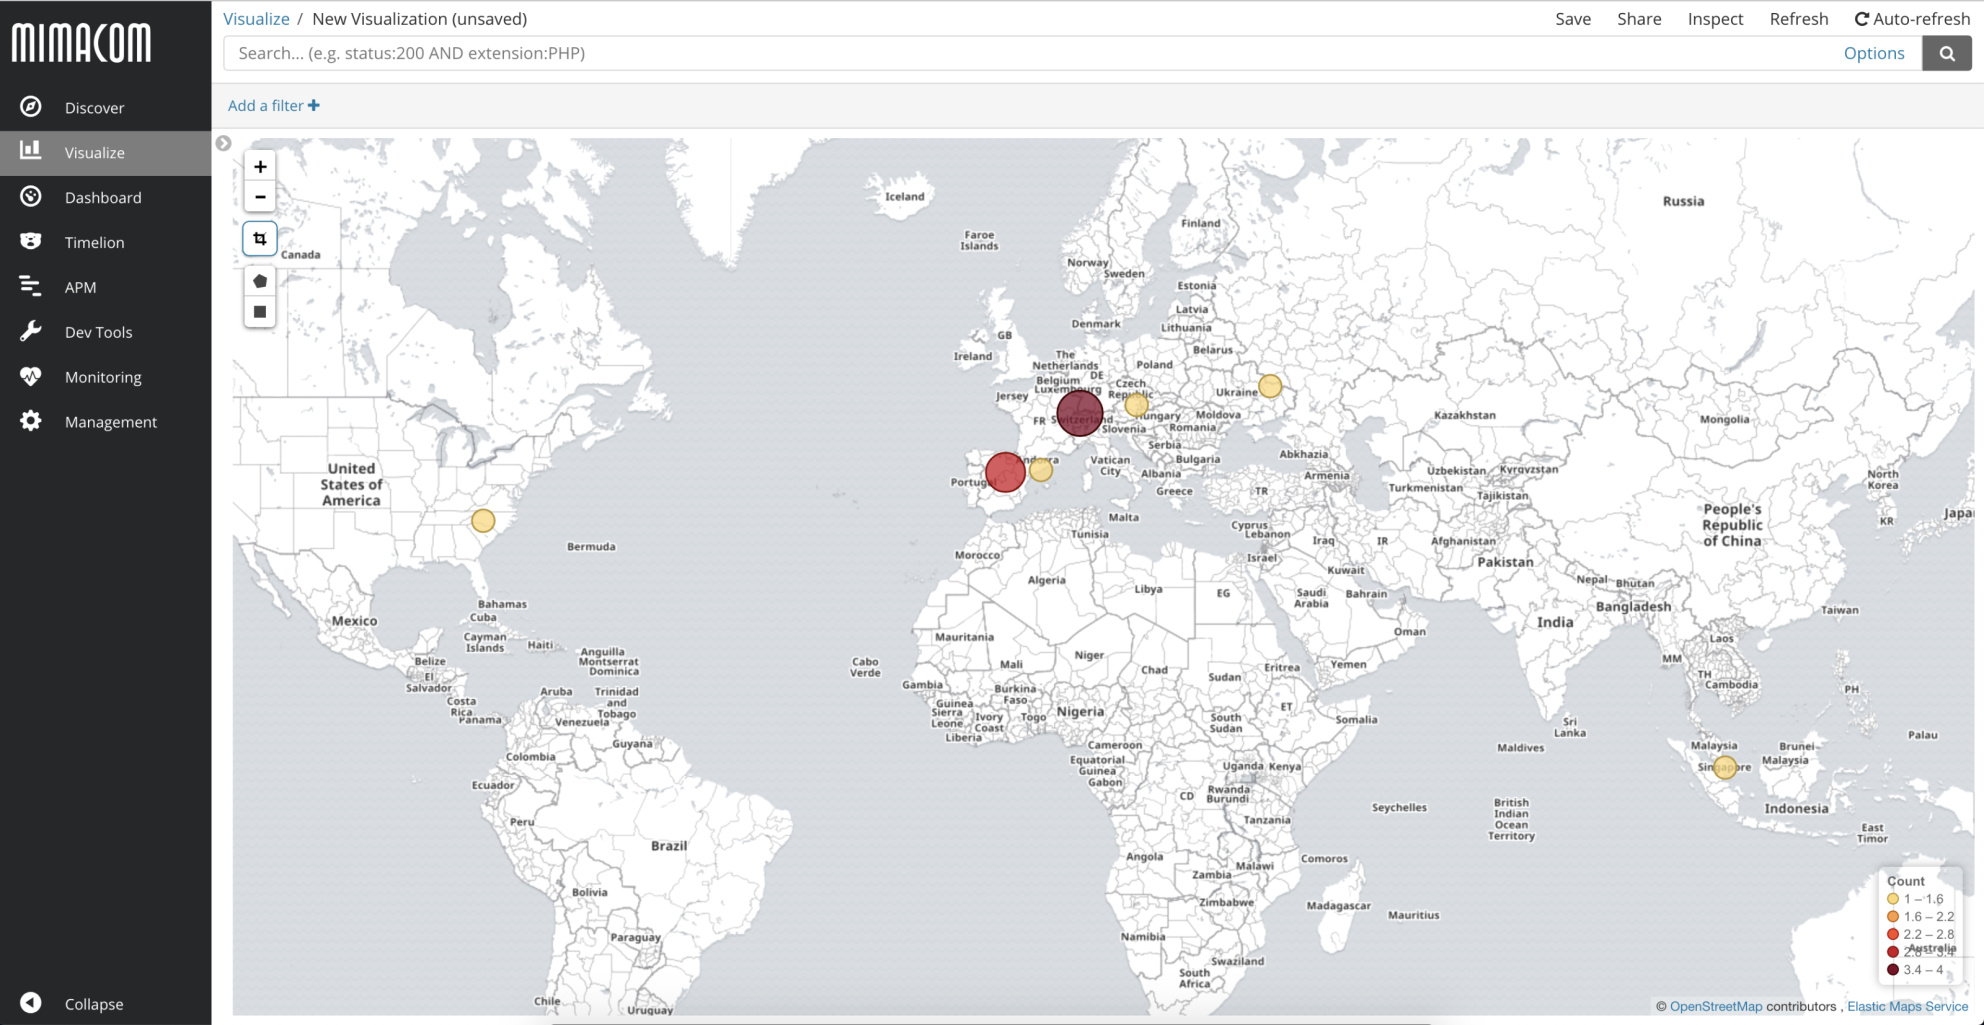
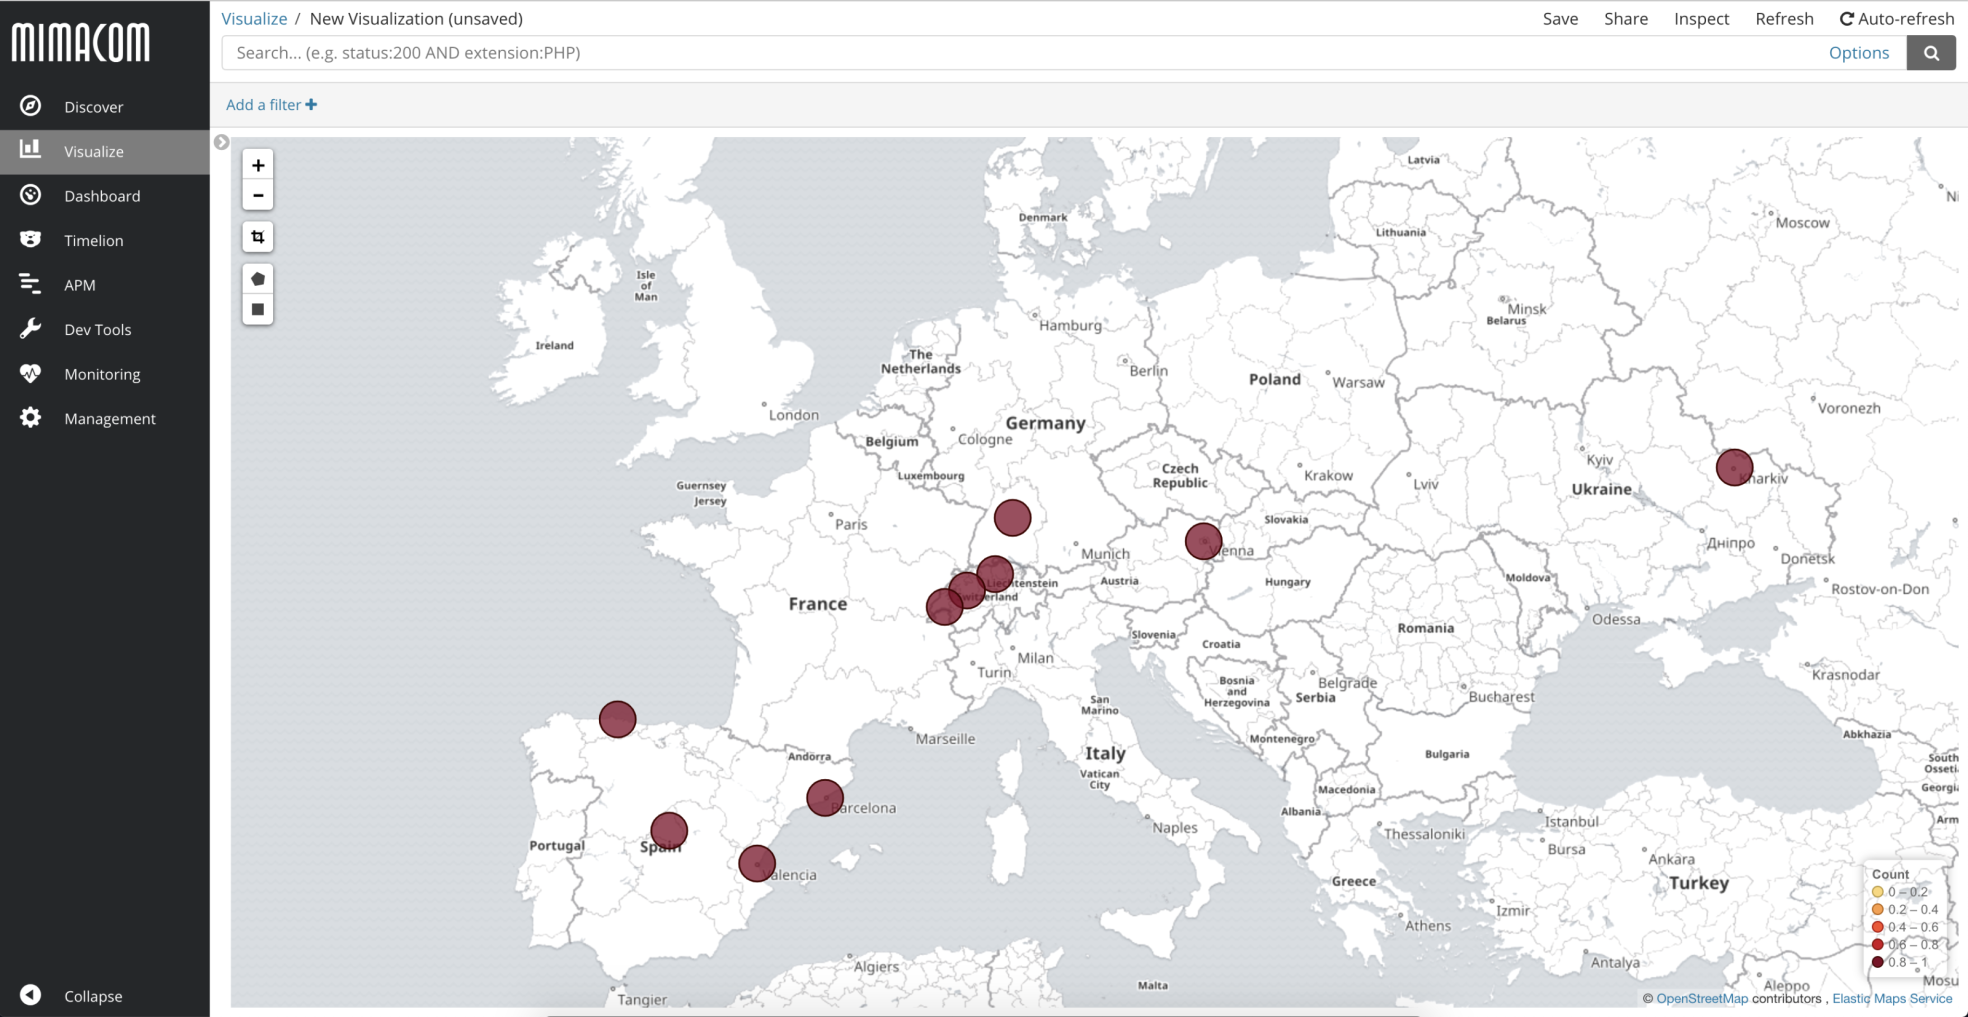
In the above picture, you see a higher concentration in Europe. If you zoom on Europe, you receive a more detailed overview.
Uncover Data Relations
One of the significant strength of Elasticsearch is time series data. If you have revenue numbers for each location, you are capable of analysing their share at a certain point in time.
Following example is base on generated test data for the company Awesome AG, which happens to have the same locations.
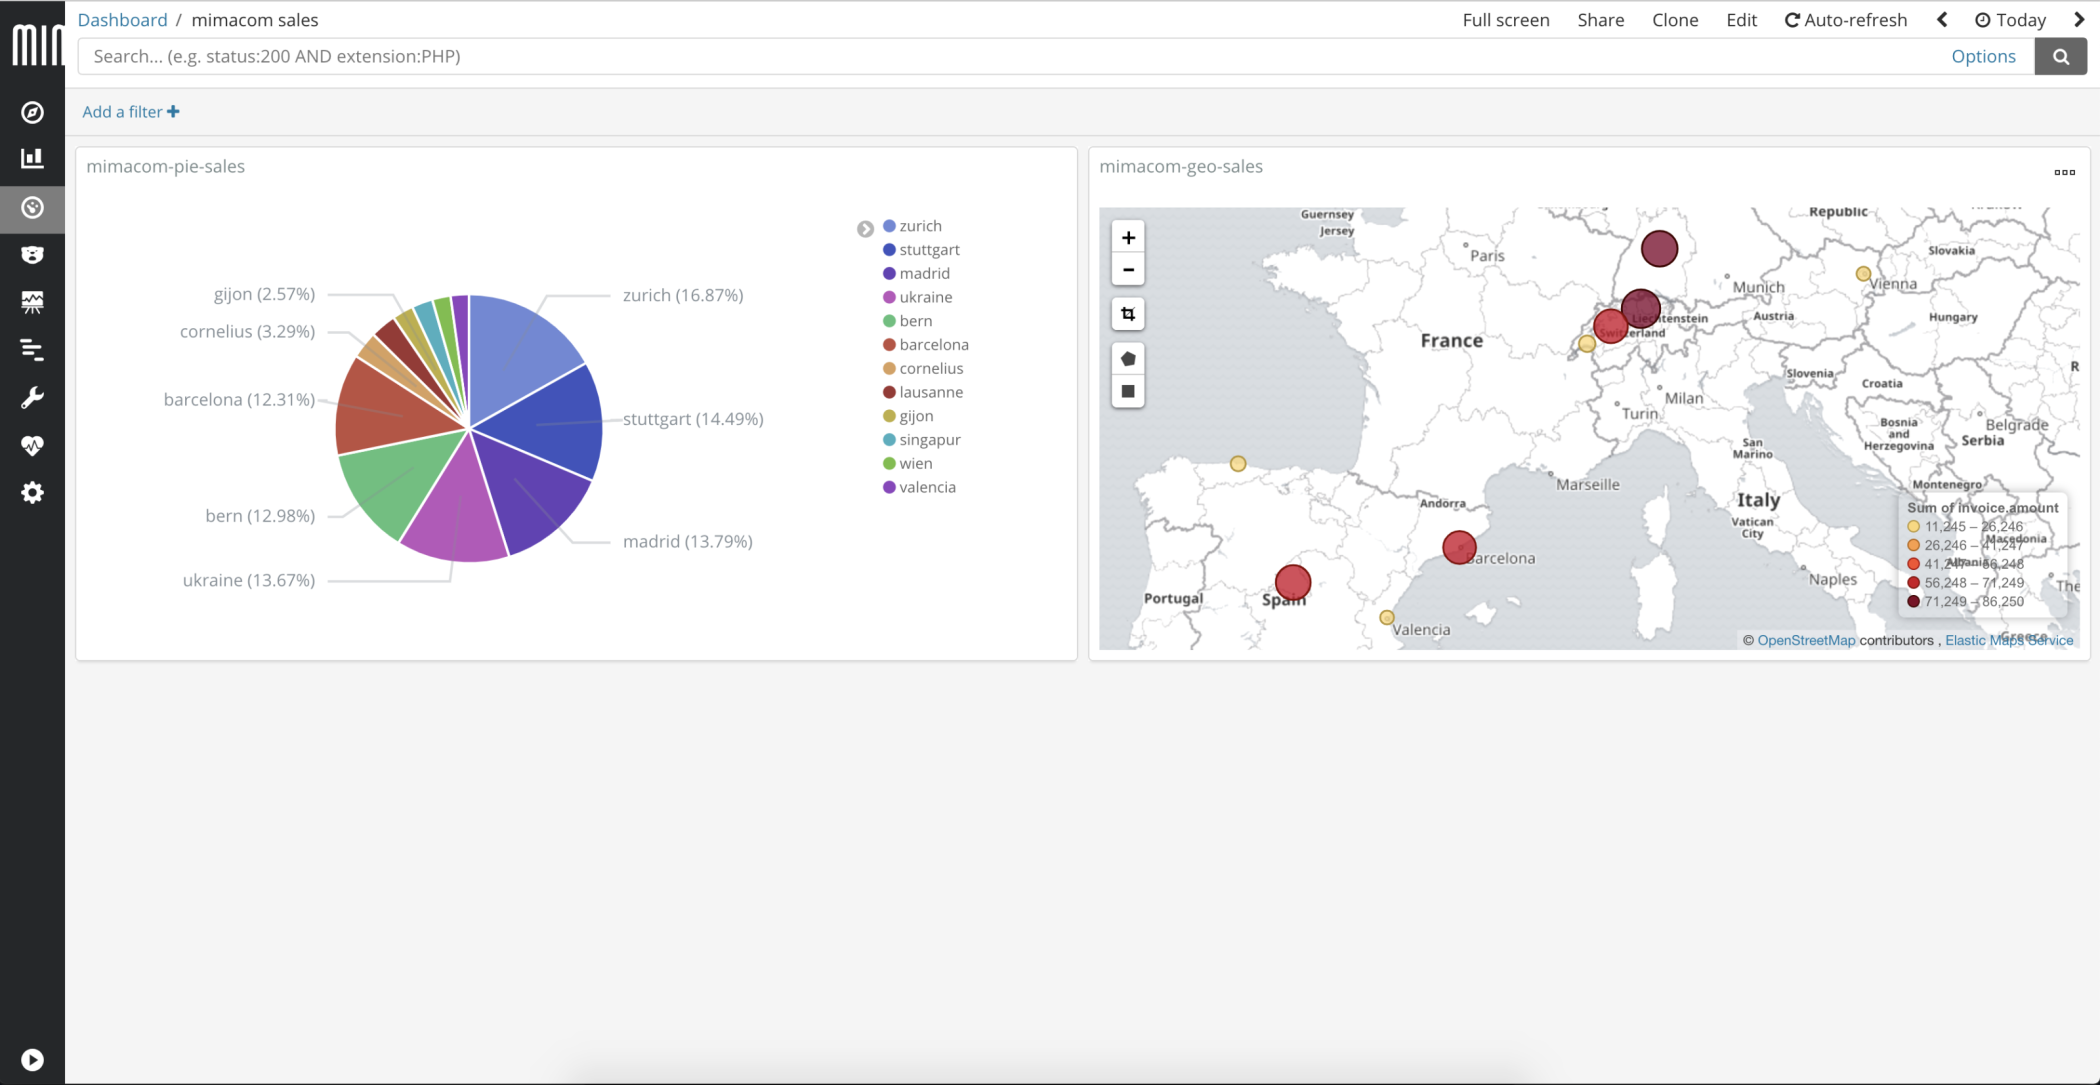
To view the revenue share for each location a pie chart is very common.
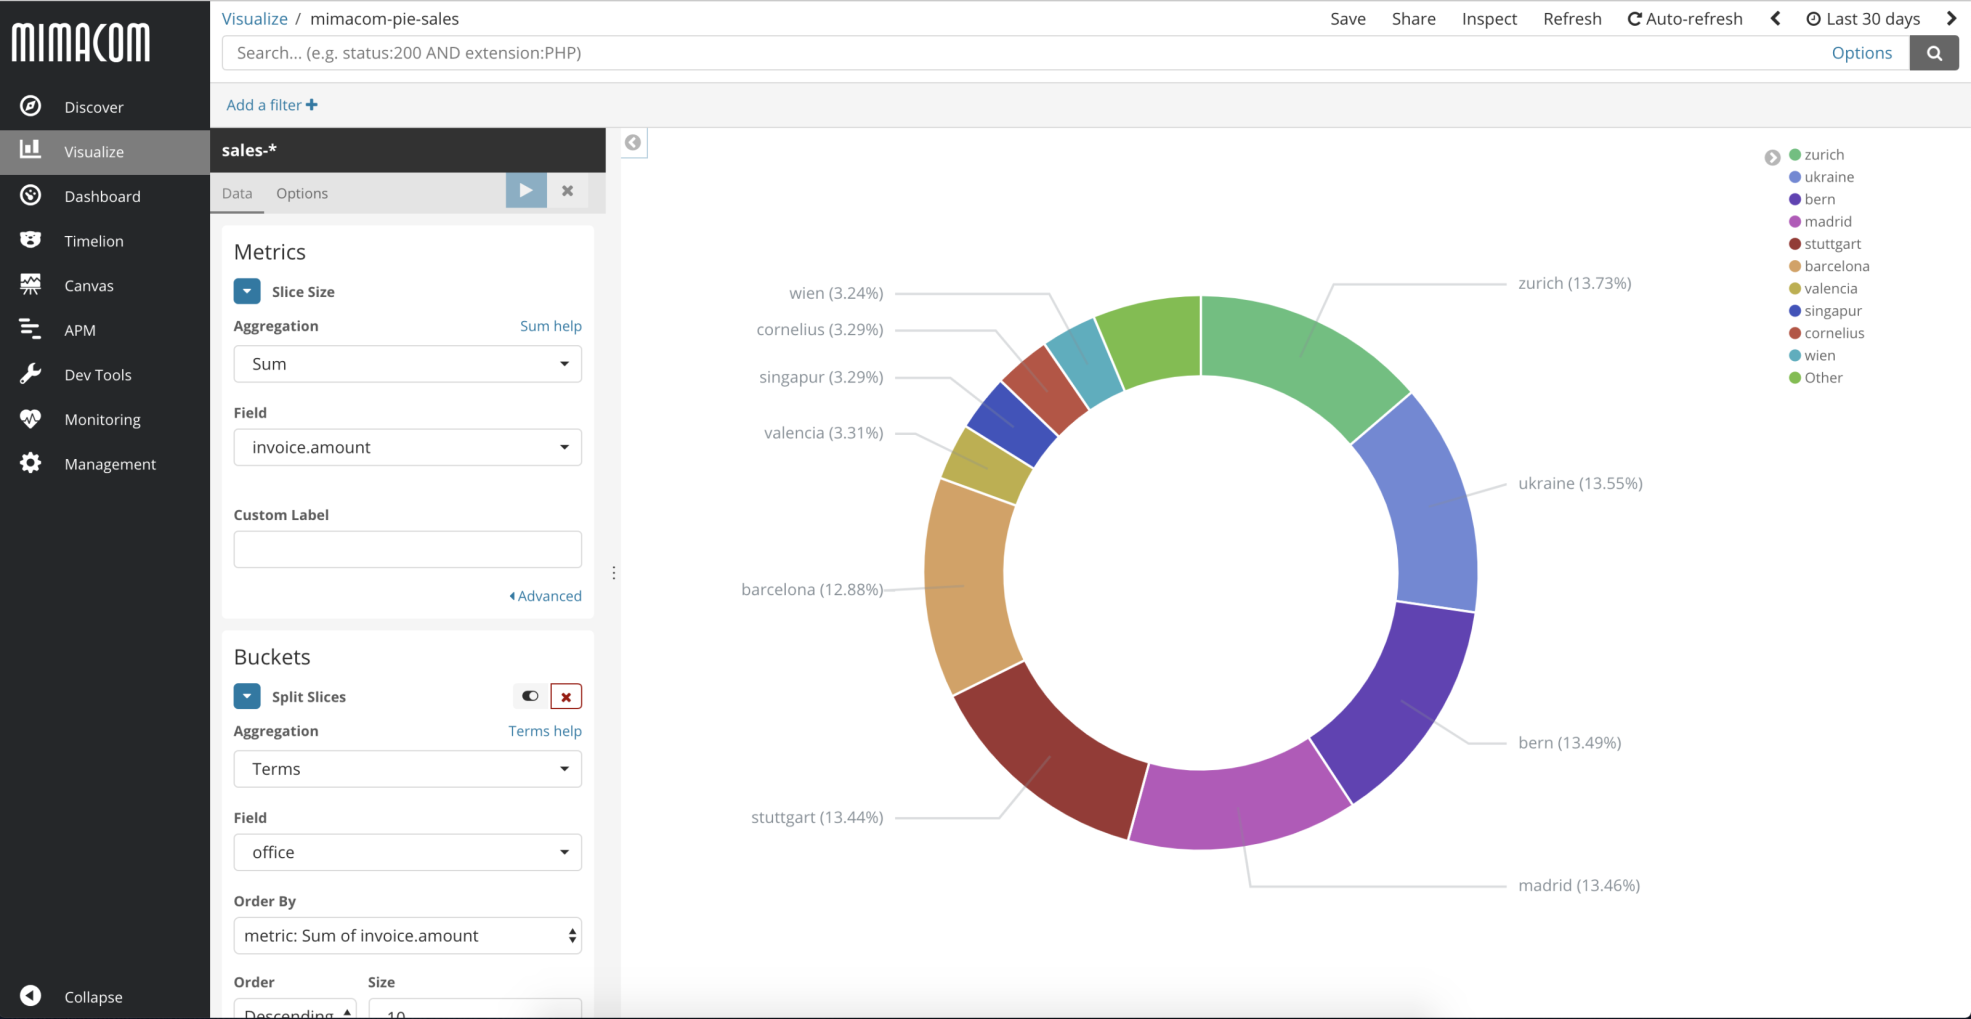
You can present the same information in a coordinate map.
You don't have to choose between the one or the other visualisation. You can combine both visualisations in a Kibana dashboard.
Summary
Elasticsearch and Kibana offer easy solutions to begin quickly with geospatial information. Geocoding enriches your data. It allows you a geographical view that may provide additional orientation. In the next article, I am going to elaborate more on the benefits with geo distance analysis.