Use Kibana heat maps for Crime Mapping
In my last articles, I have introduced the foundations for storing geospatial information in Elasticsearch. For various use cases, Kibana and the Elasticsearch Query DSL offer powerful features to solve specific problems.
In this article, I am going to introduce Crime Mapping. Crime Mapping utilises GIS (Geographic Information System) for identifying crime hot spots, along with other trends and patterns. I demonstrate the usage of heat maps to detect hot spots. Pay attention, that this is not a hotspot analysis!
Disclaimer
Note that I am no GIS expert. Mimacom has a lot of highly skilled and experienced engineers for that. For instance Jesse Eichar or Nadine Piveteau. Both studied and worked on GIS projects. We also have a passionate group of data scientists, which use their given education time to progress in that area. Just count me out of these both groups. My motivation is to explain how to use heat maps on crime data, not explaining the crime data itself. The exciting part is always the data, but we have experts for that ;-). Fair enough, they all have inspired me on this story. I might elaborate a little bit about the data if it suits the demonstration.
The Data
The idea to write about crime data rooted from Riccardo Causo and he pointed me to the following datasets. I use open data from Vancouver (Canada) and Los Angeles (USA). This crime data came from the respective police departments. Both data sets are available on Kaggle, a platform for Data Science and Machine Learning. I have analysed and transformed the data for Elasticsearch. I use Python libraries for Data Science (Pandas, NumPy) and Logstash to import the data.
Crime Mapping
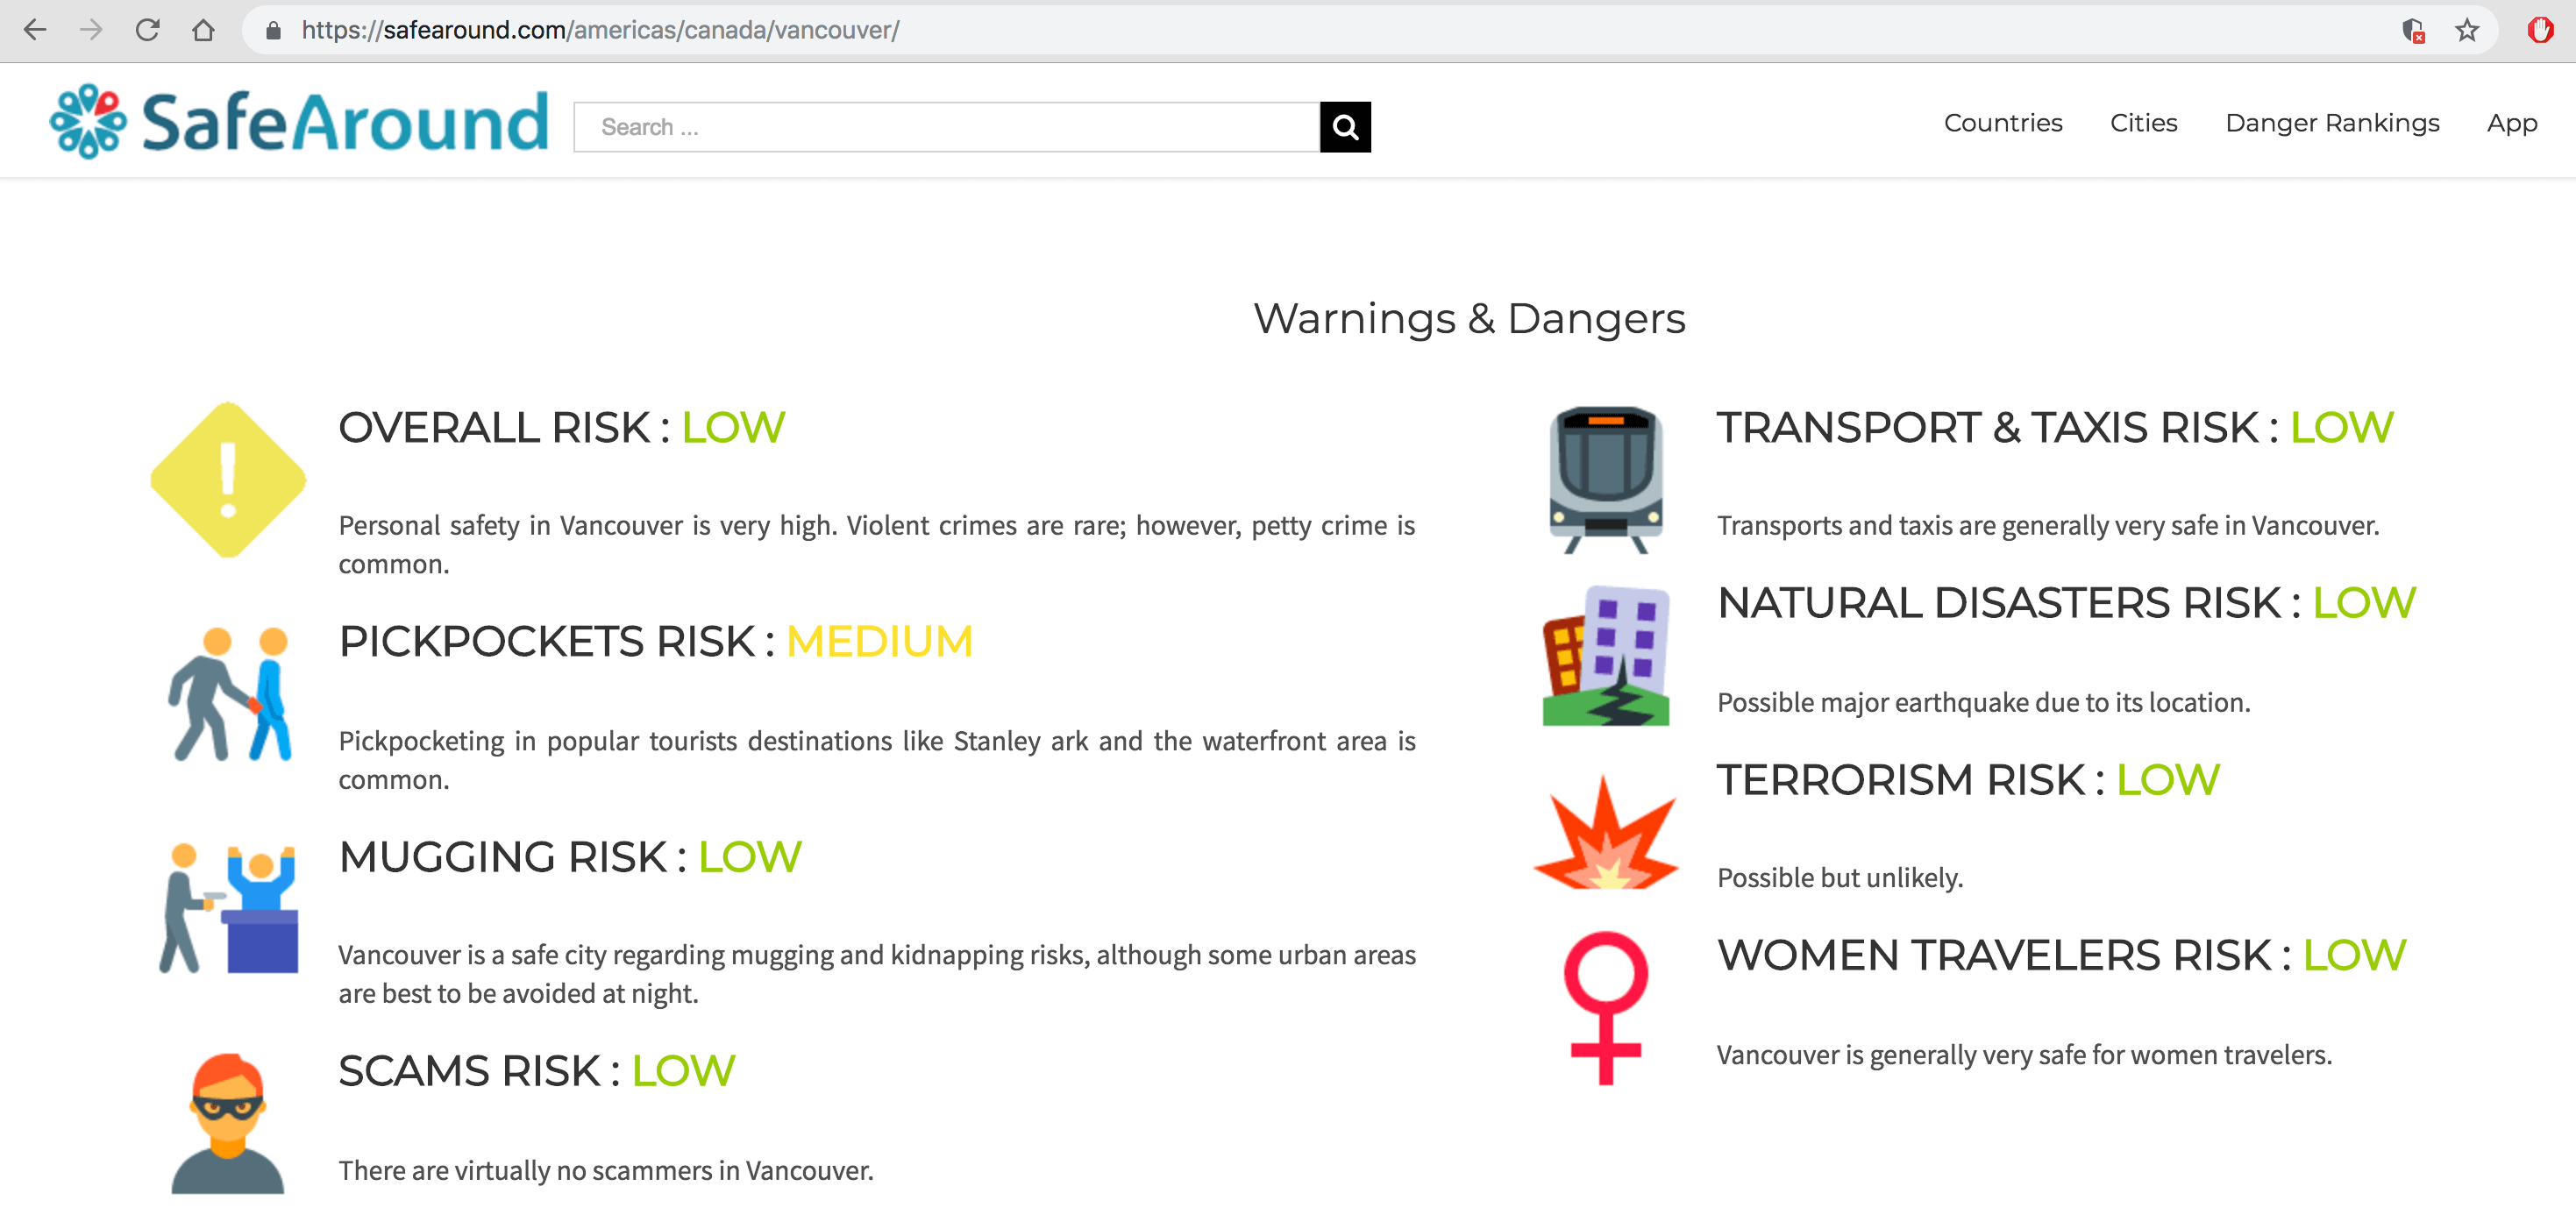
Who uses crime mapping? Law enforcement and government agencies, insurance companies, real estate and tourism officials using crime data to analyse and compare statistics of areas and neighbourhoods. See below a security rating of Vancouver for tourists.
Workspaces in Kibana
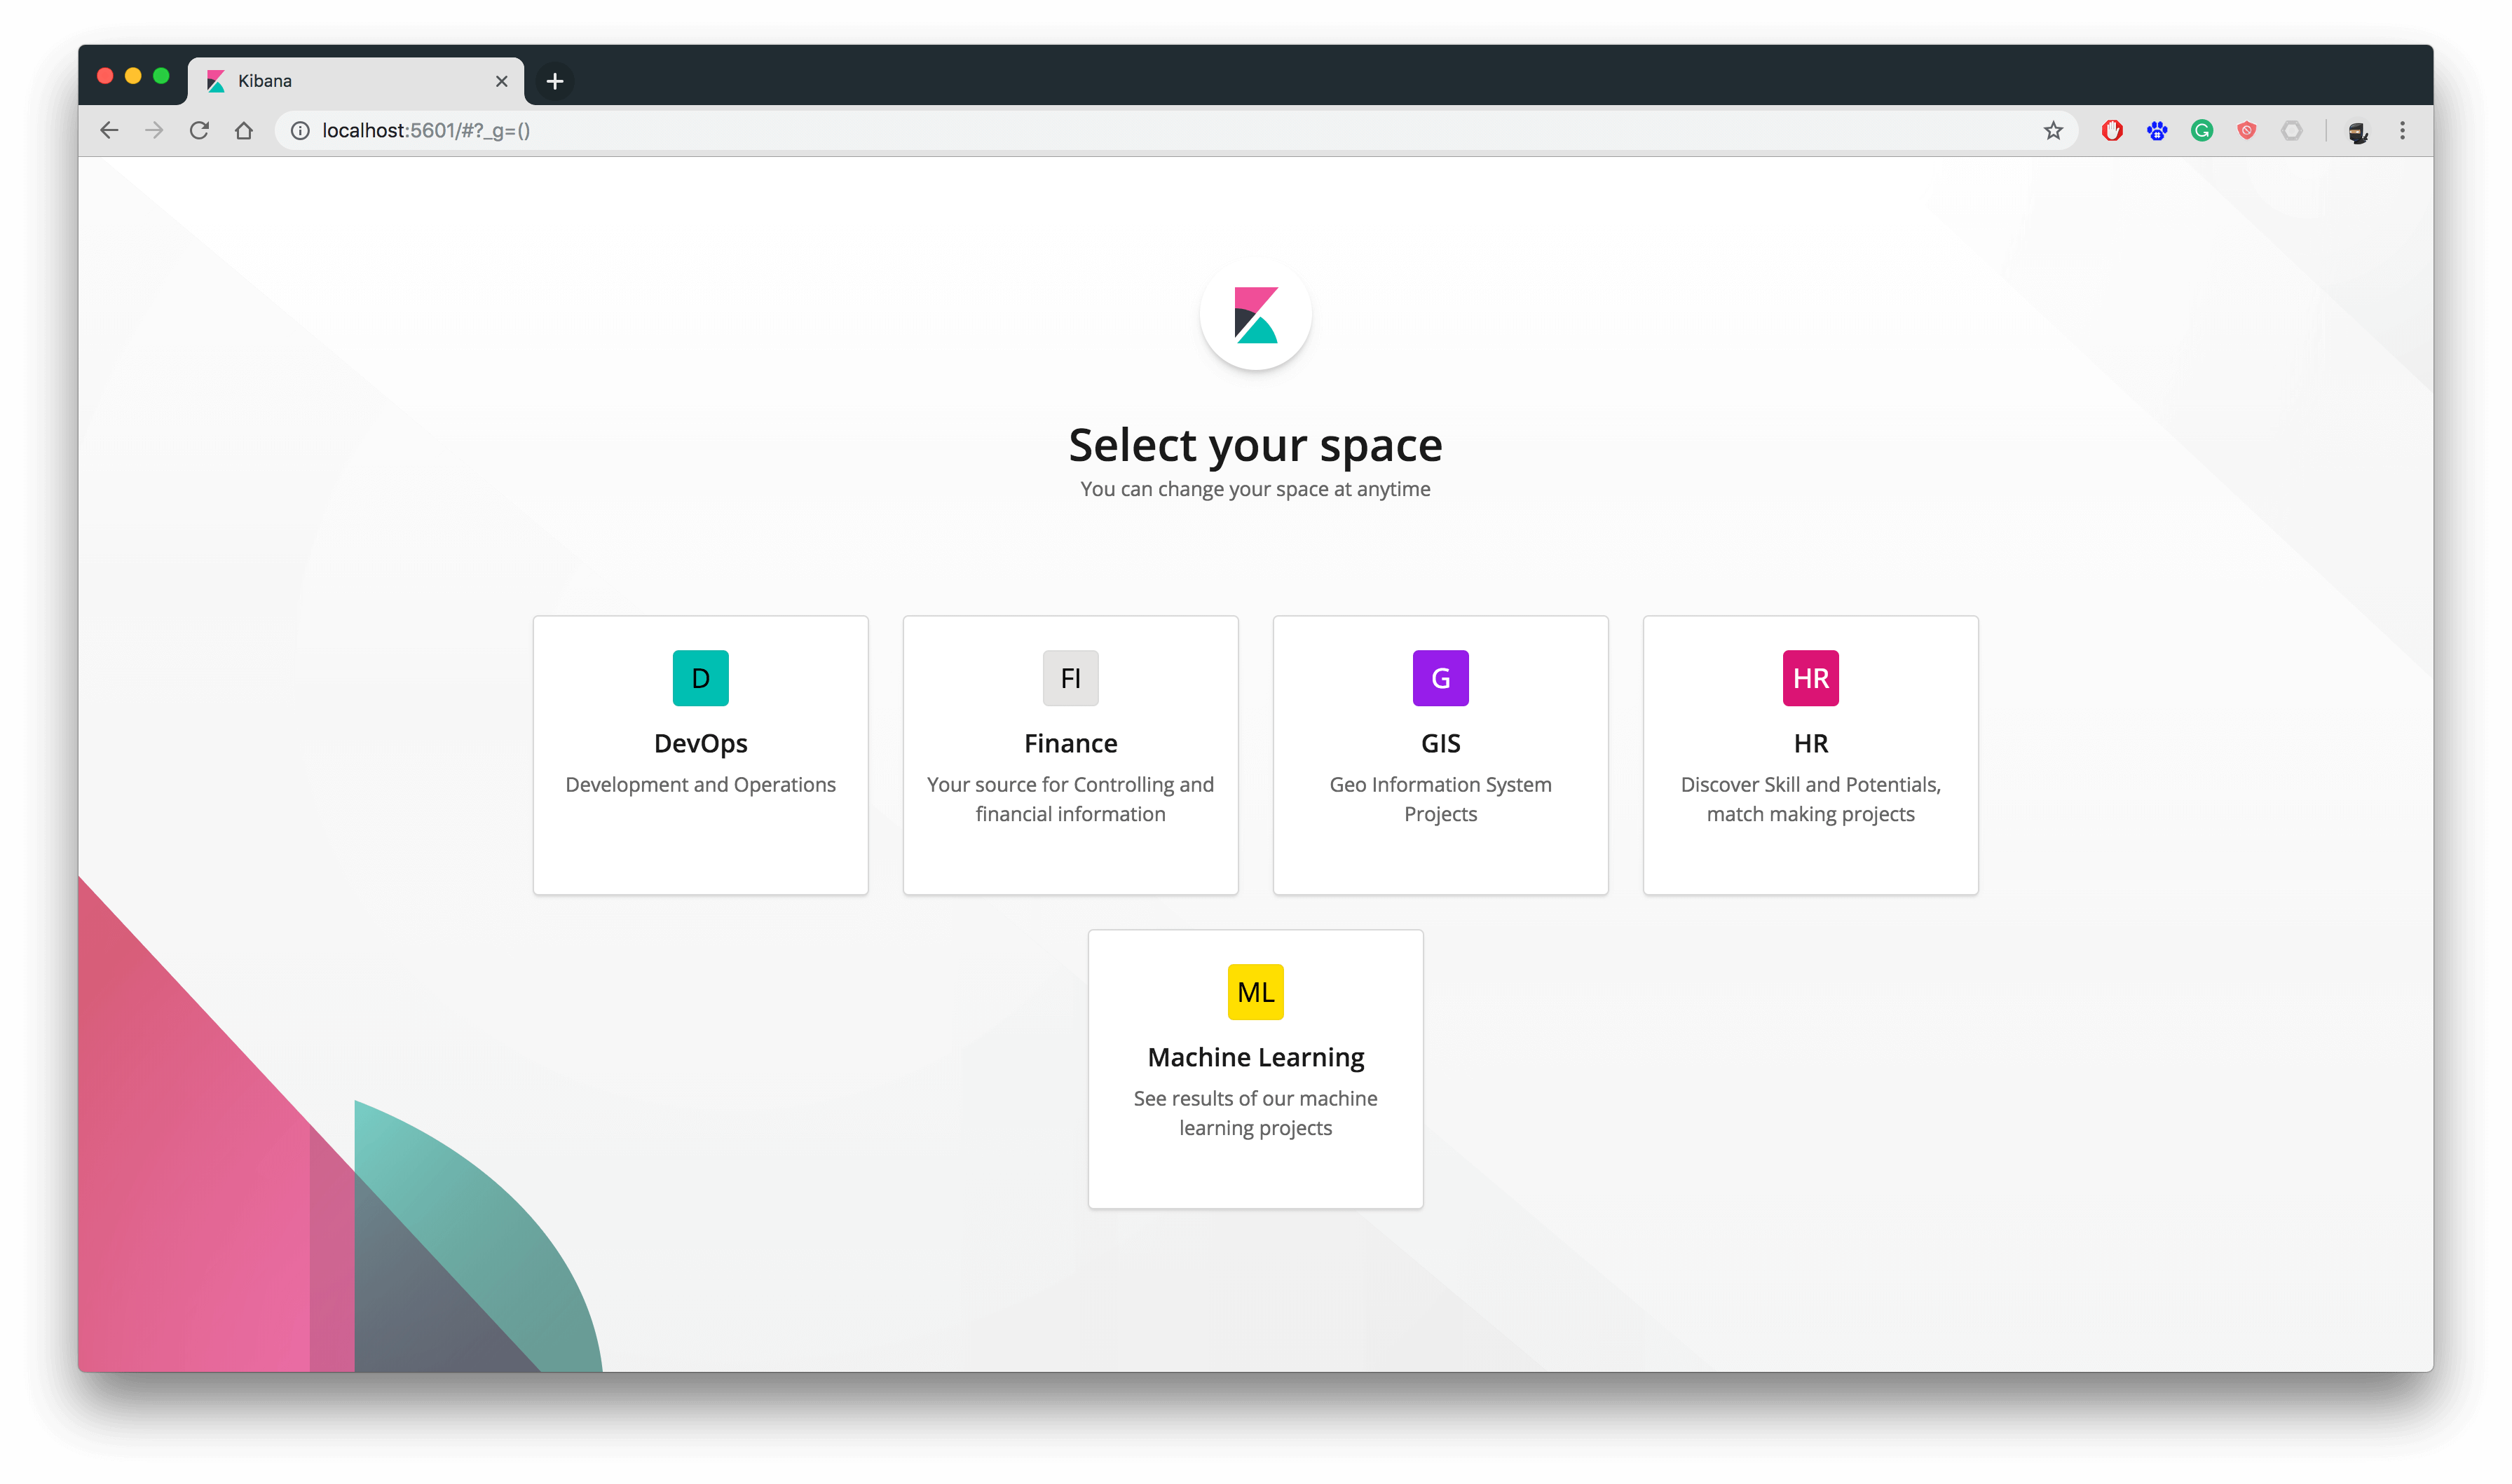
The Elastic Stack had released its 6.5 version last week. One of the feature improvements is dedicated workspaces. For our crime mapping demo, we go into our geo-projects workspace.
Heat Map
What is a heat map? A heat map is a two-dimensional representation of data in which colours represent values. A colour gradient is used to indicate areas of higher density. A higher crime rate resolves to red (hot), contrary to a lower crime rate as blue (cold).
Heat Map Chart
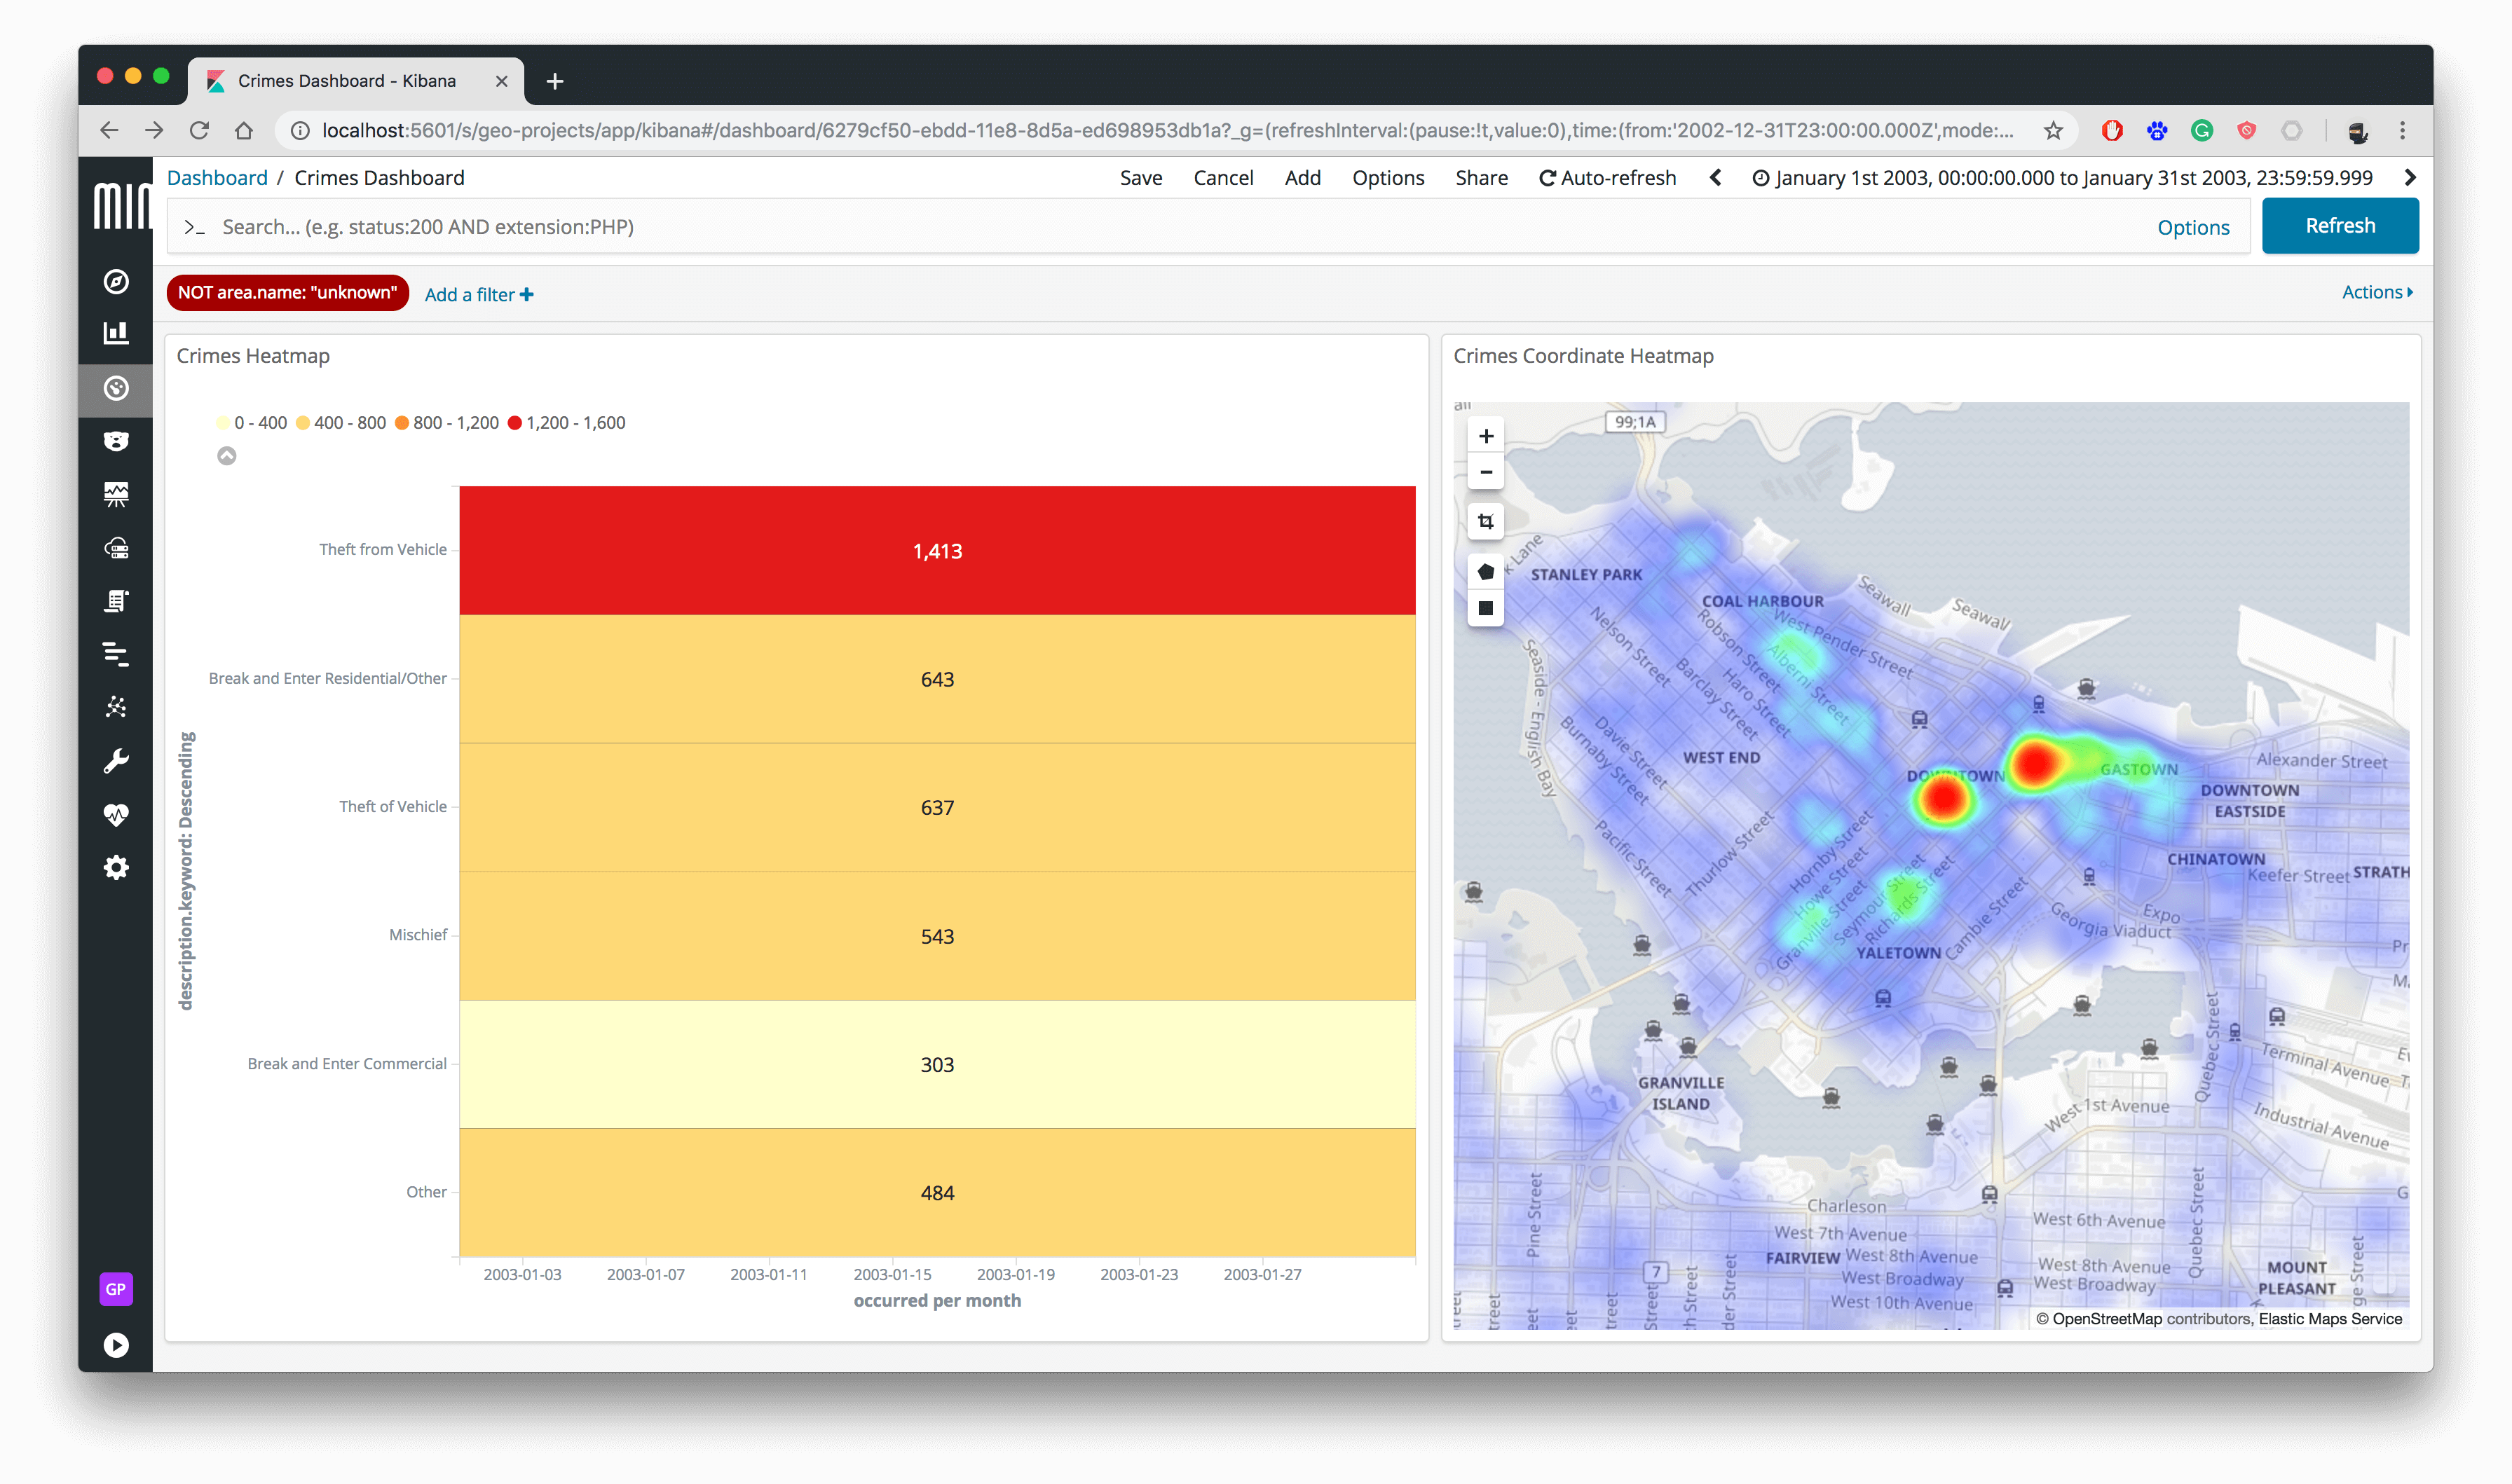
We look in our first example, into the data of the Vancouver Police Department. We have 530'653 crime events for the years 2003 to 2017. Let us create a heat map visualisation. As time range we choose the year 2003. As x-axis each month in 2003 and as y-axis the top 5 crime types.
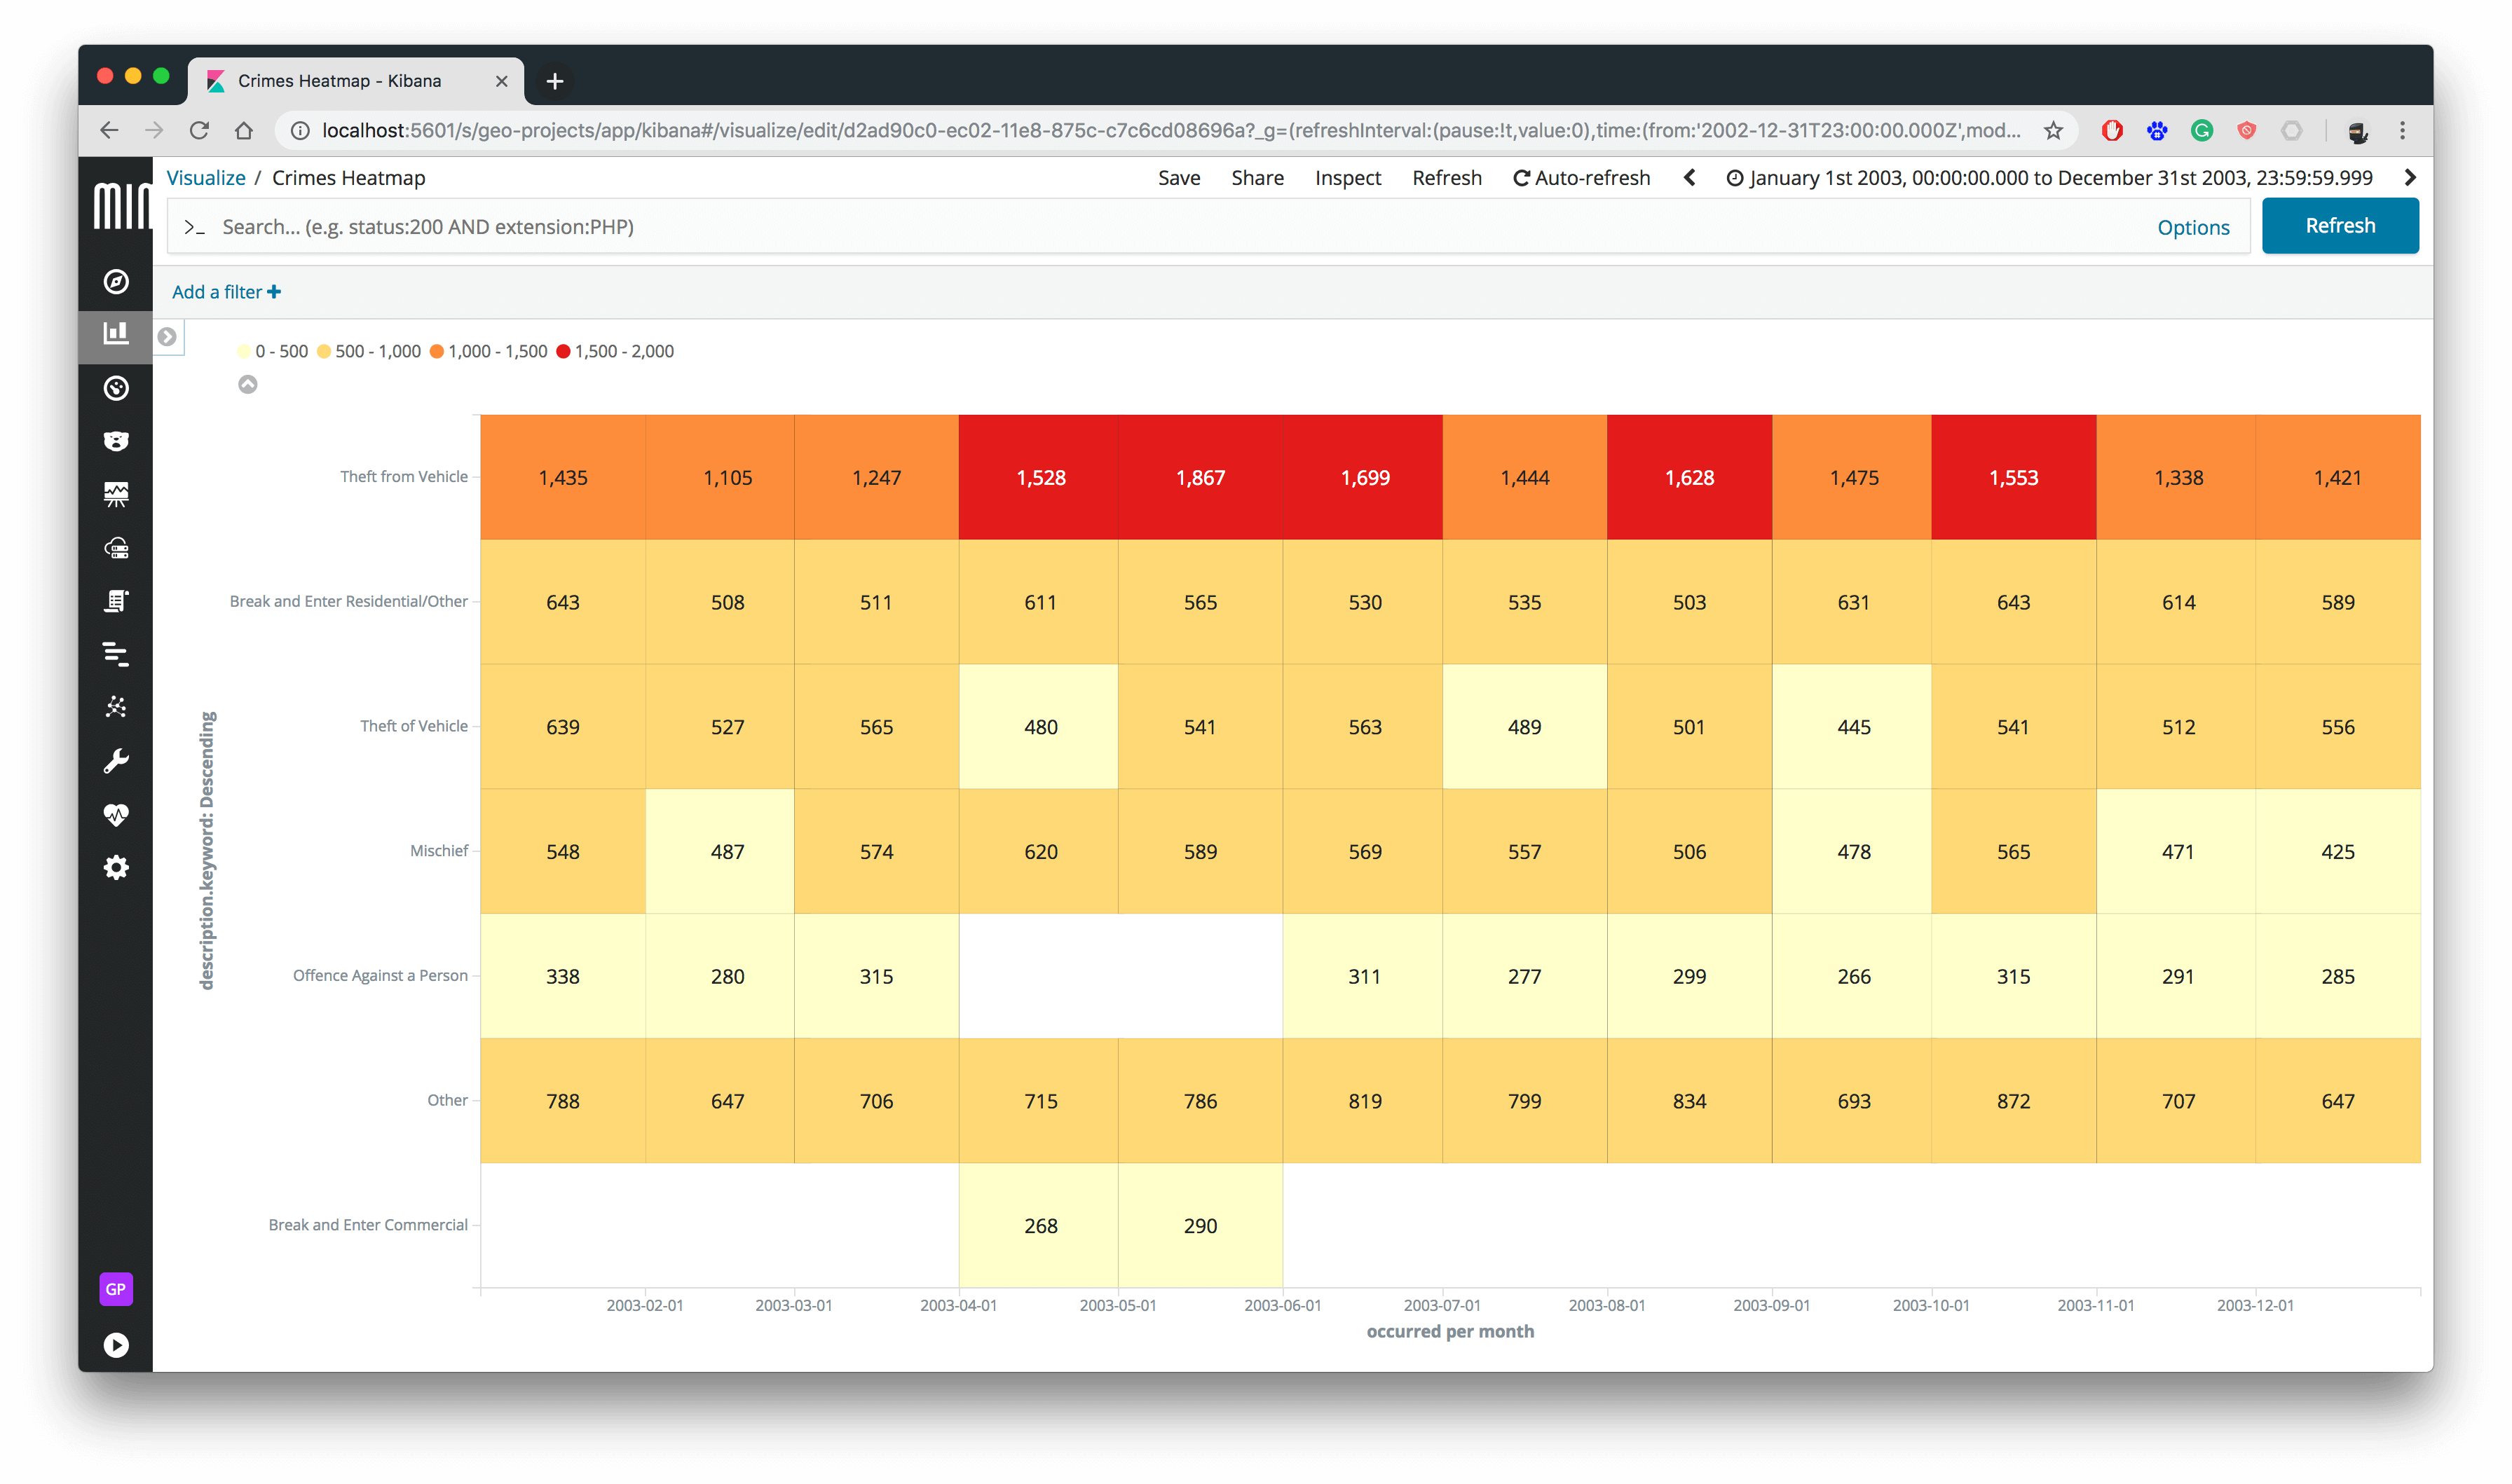
You can see four ranges of colour clustering. The figure displays for each crime type and month the count of crimes. For instance Theft from Vehicle has its high in May 2003 with 1'867 crime events.
Coordinate Heat Maps
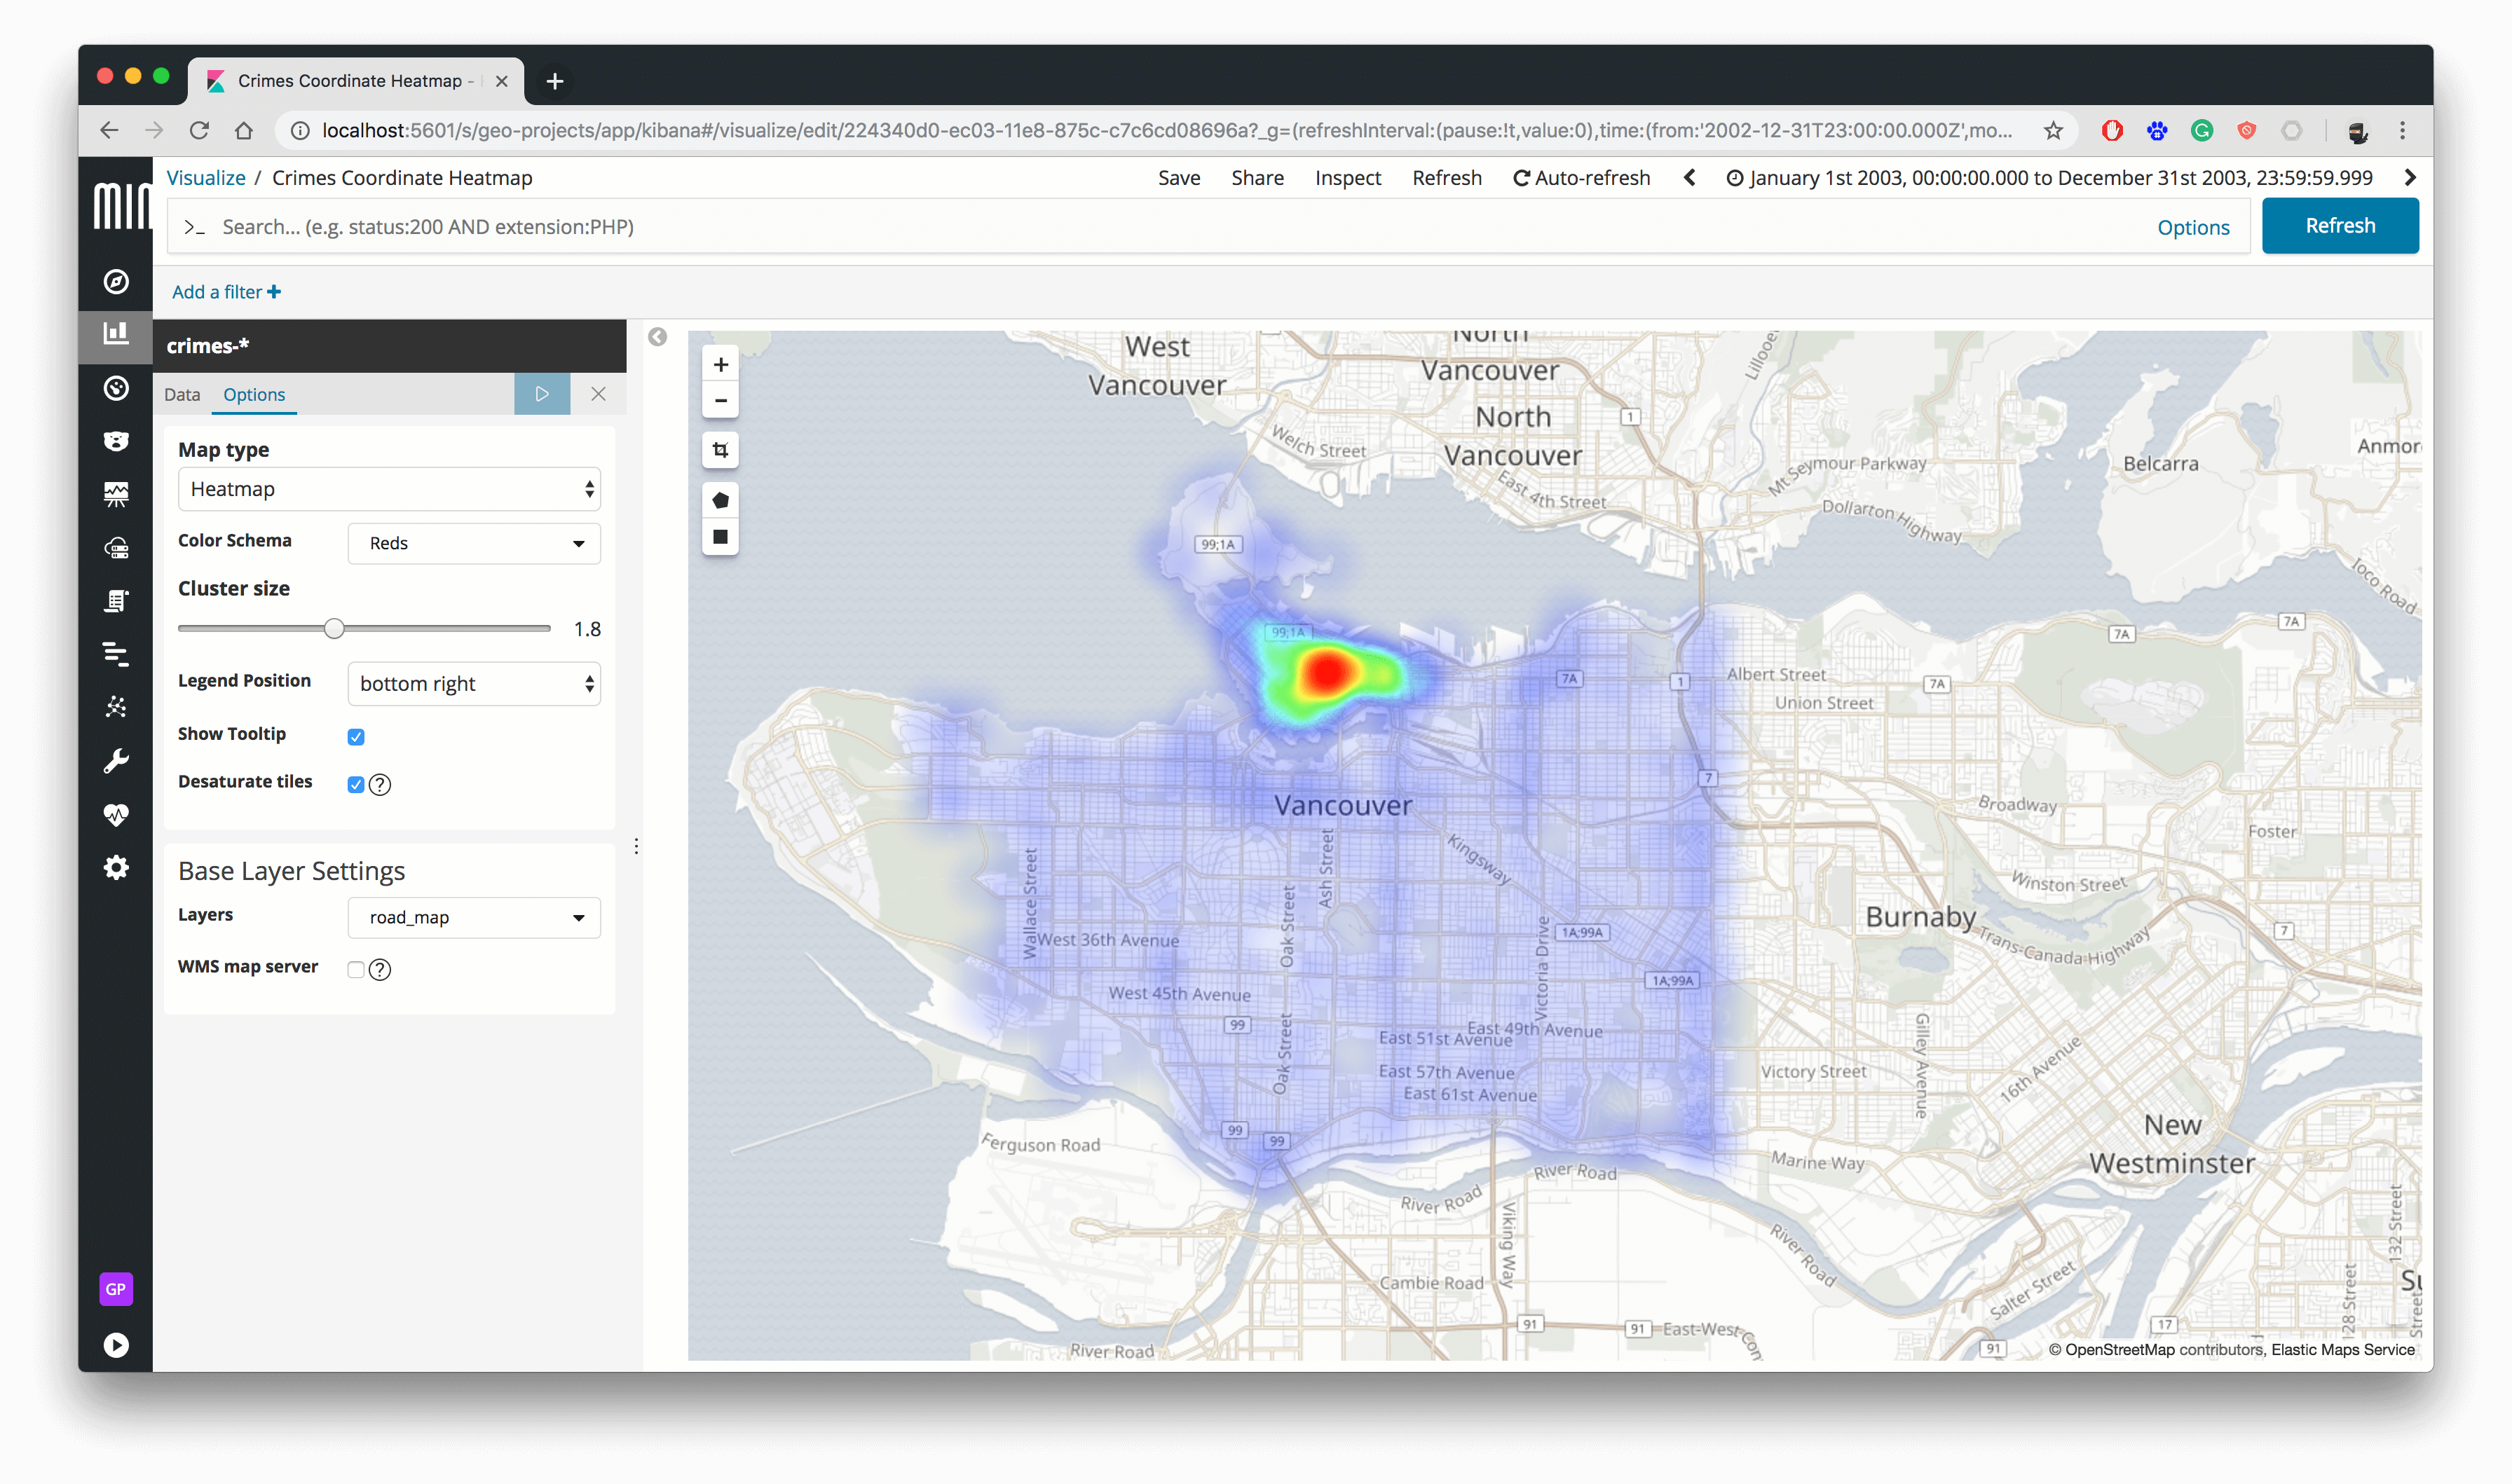
If we switch to the Coordinate Map in Kibana and change the map type to Heatmap, we see a heat centre. This level of detail depends on the map zoom.
If you combine the view in a dashboard and only look for January 2003, we see a different picture.
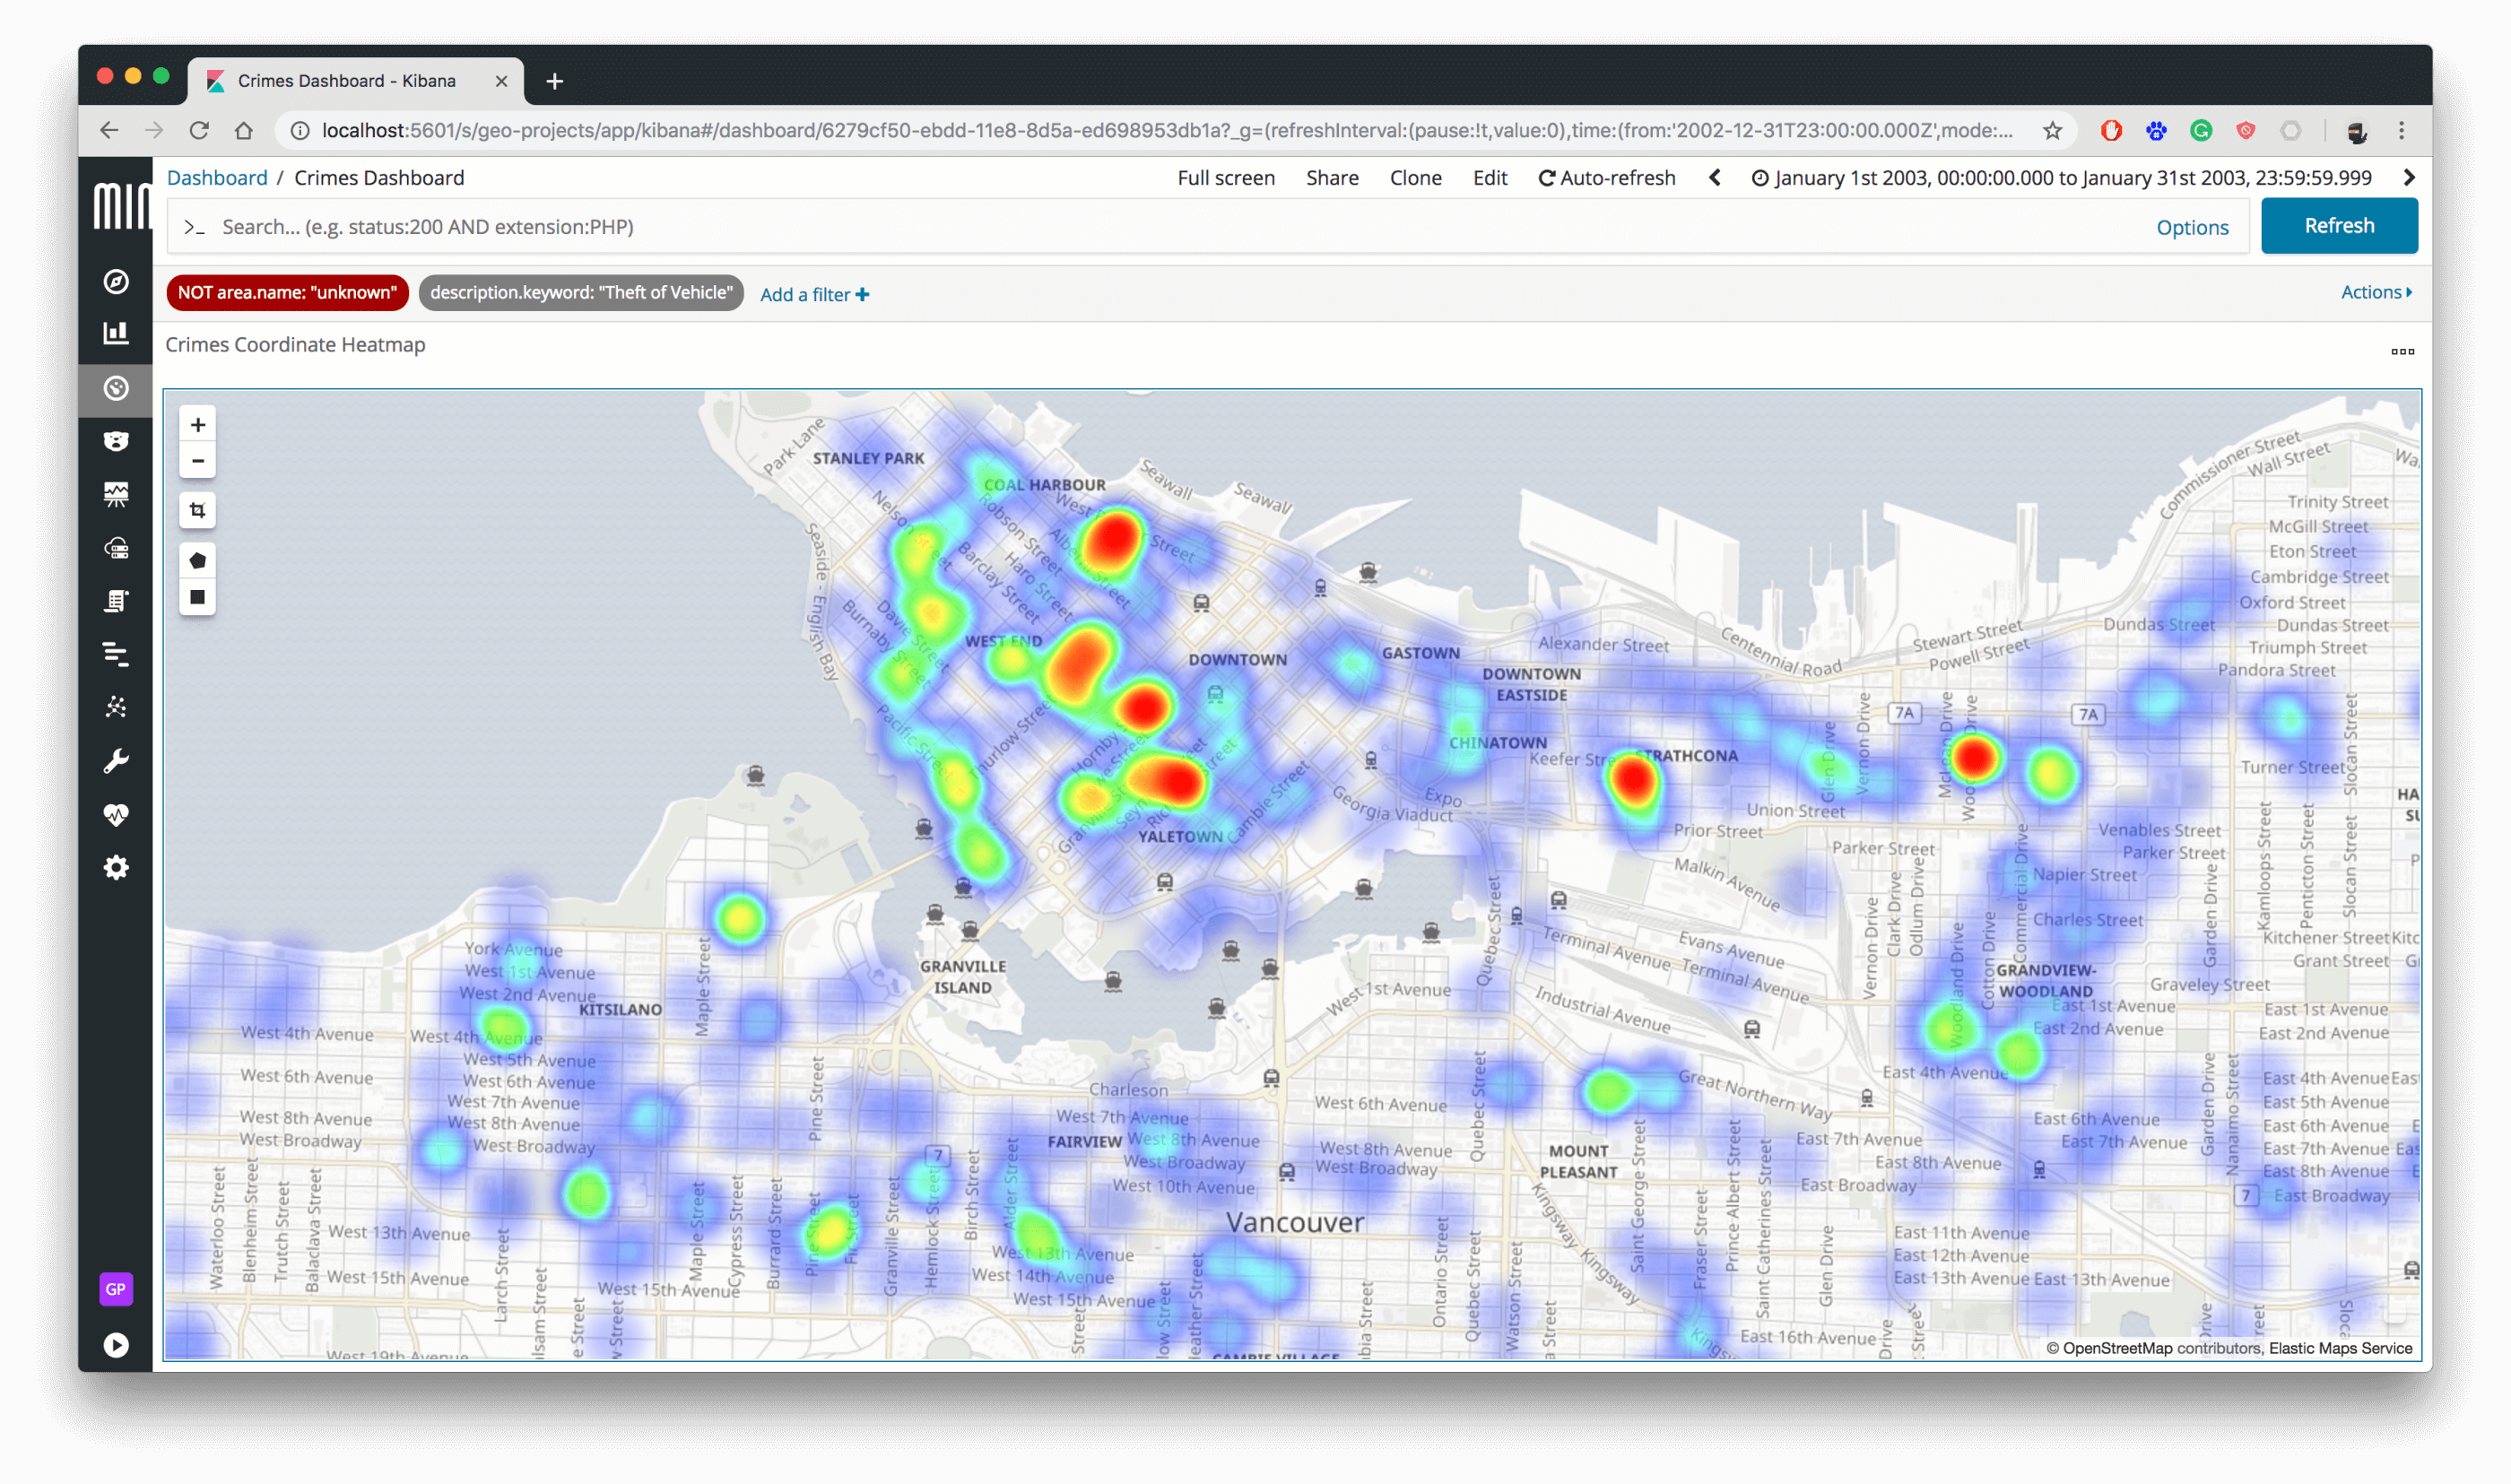
One strength of Elasticsearch and Kibana is the data filtering. If we look only for the crime type Theft of Vehicle, we see the hot spots on the map for January 2003, where most of the thefts have been committed.
Let us look into one document source for the Vancouver crime event.
{
  "_index": "crimes-2003",
  "_type": "doc",
  "_id": "vpd-24841",
  "_source": {
    "occurred": "2003-01-31T20:00:02.184830",
    "location": {
      "lat": 49.22057297,
      "lon": -123.0887167
    },
    "@version": "1",
    "description": "Theft from Vehicle",
    "country": "Canada",
    "area": {
      "name": "Sunset"
    },
    "state": "British Columbia",
    "city": "Vancouver"
  }
}
For illustrating heat maps, the data set of Vancouver is sufficient.
Advanced Crime Mapping
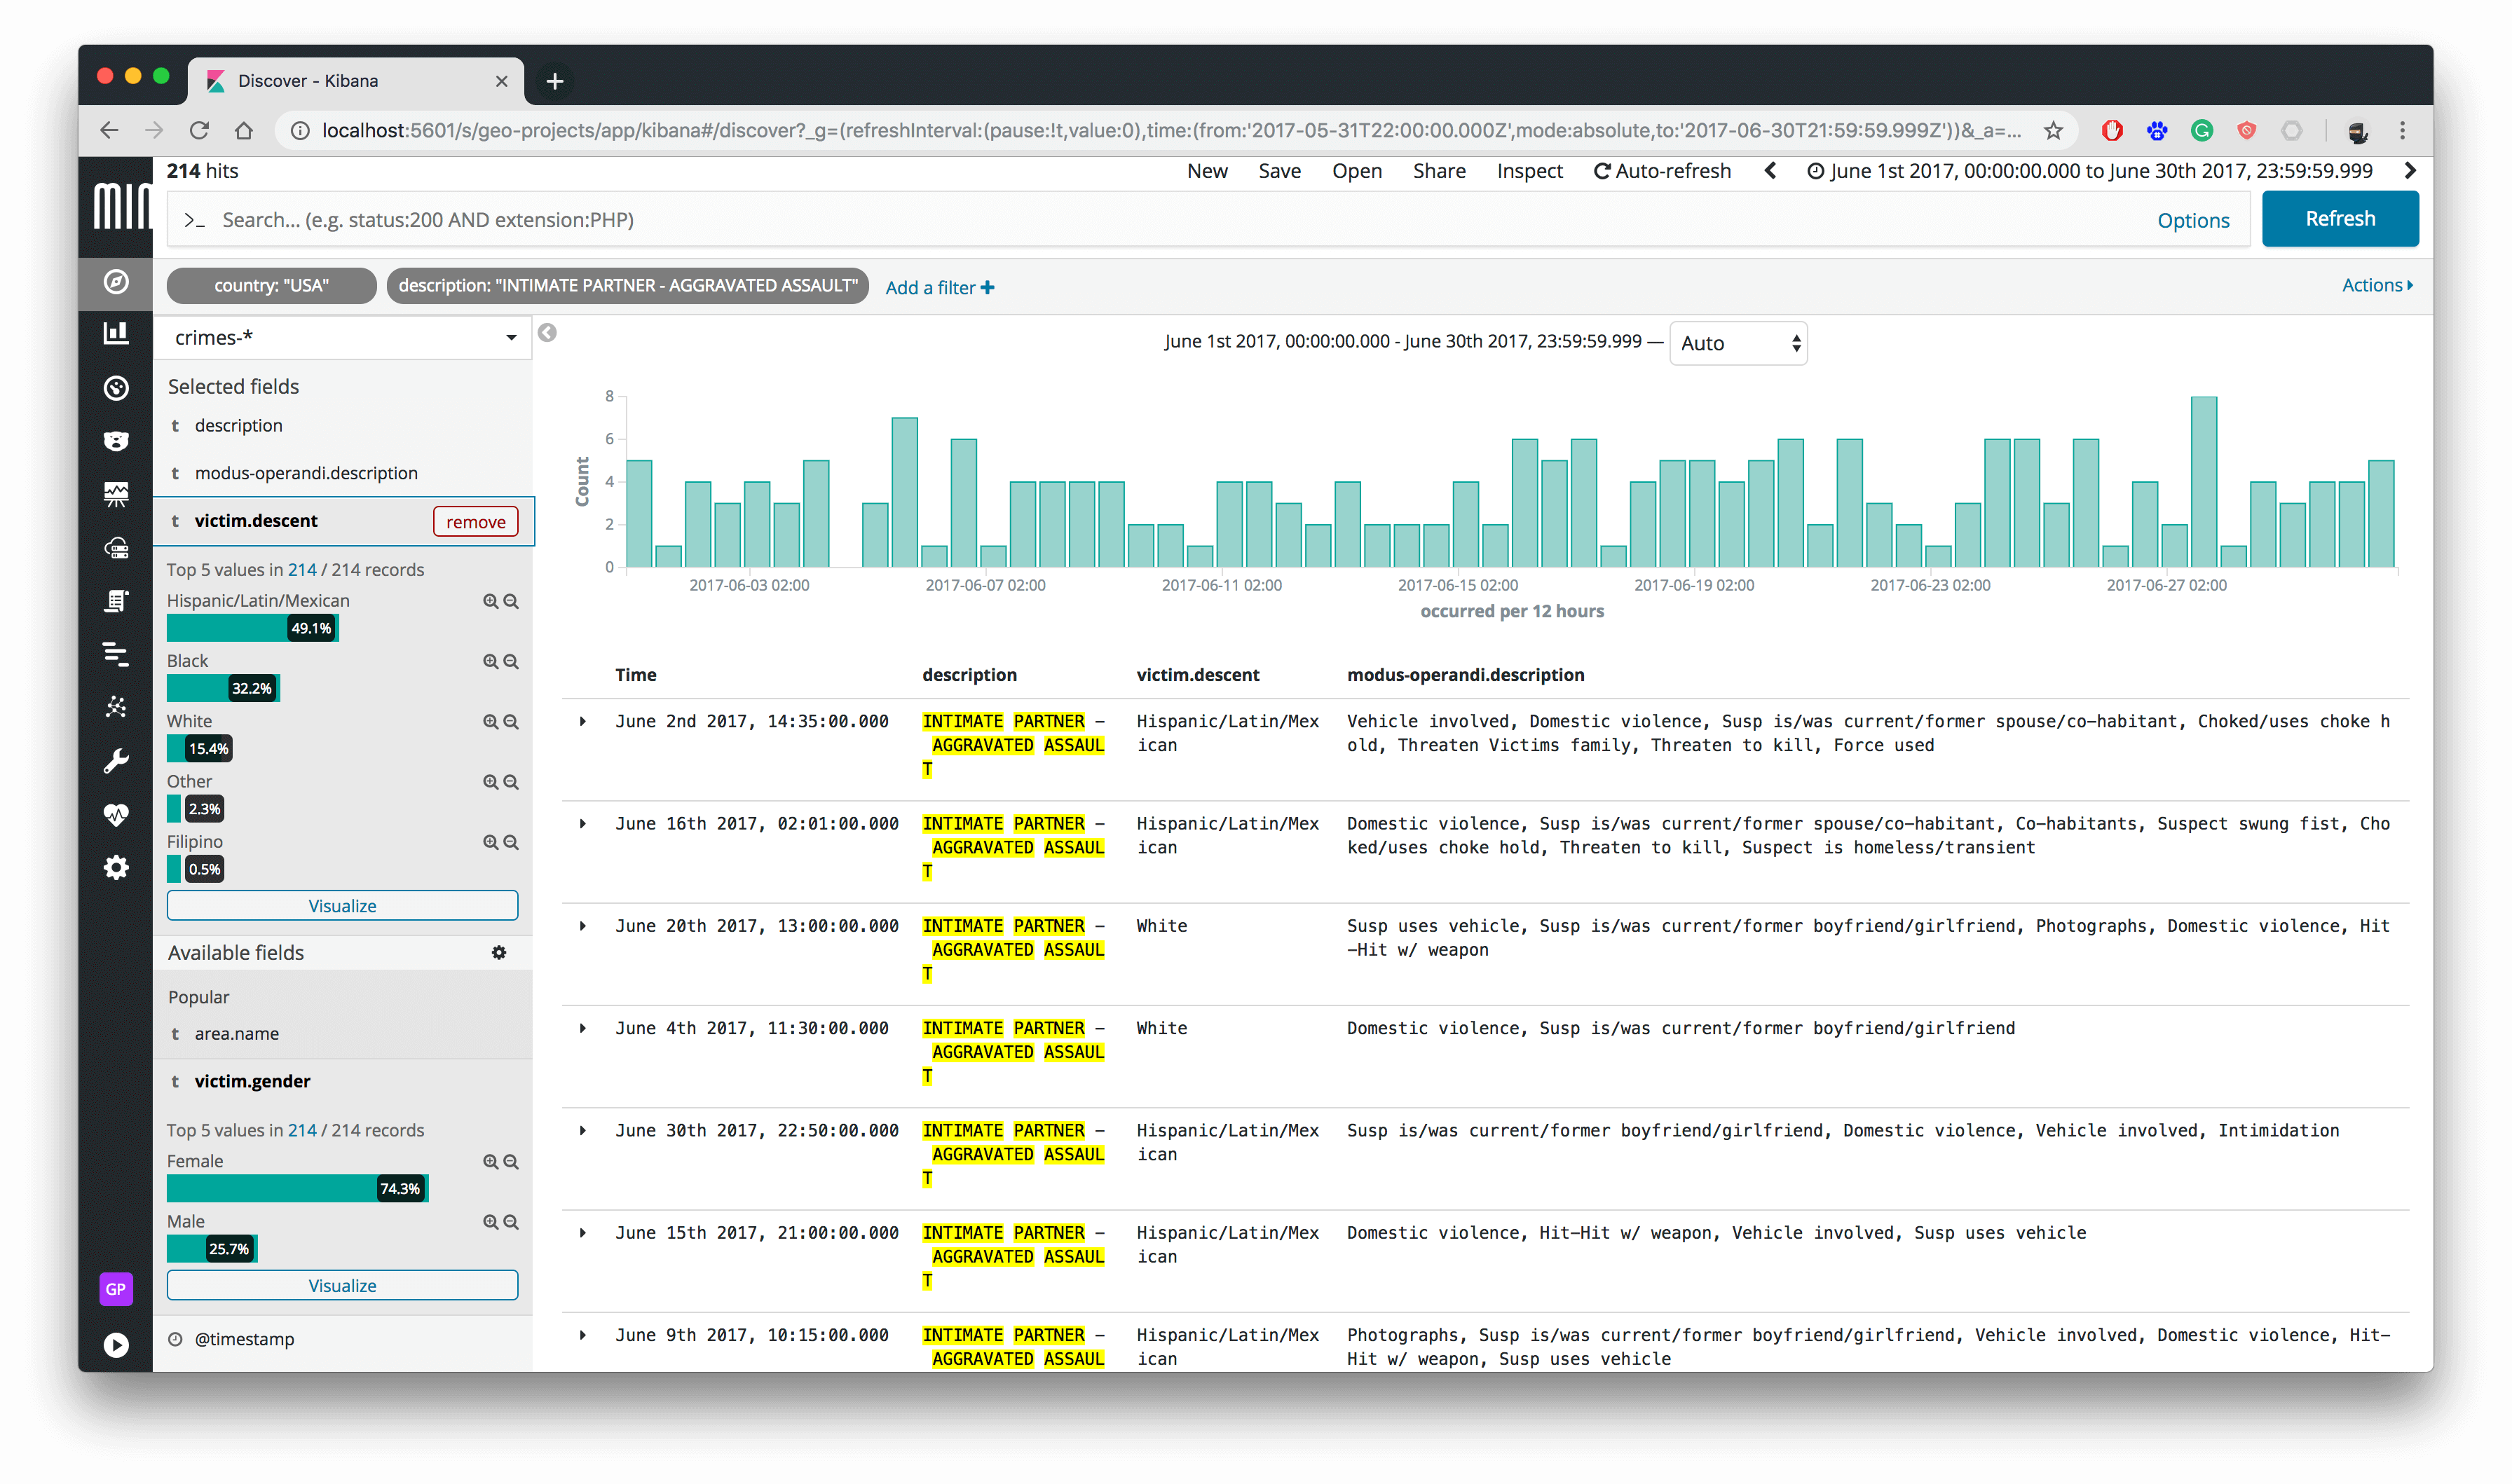
If you want to do more with Crime Mapping, like identifying dangerous areas for women, you need more data. In this case, we need data about the victims. The next data set from 2010 to 2017 of the LAPD contains that data. The data itself has much additional information in 1'584'315 crime events - for example the Modus Operandi or victim data. See below an example entry.
{
  "_index": "crimes-2017",
  "_type": "doc",
  "_id": "lapd-170213133",
  "_source": {
    "victim": {
      "gender": "Female",
      "age": 67,
      "descent": "Hispanic/Latin/Mexican"
    },
    "country": "USA",
    "description": "ASSAULT WITH DEADLY WEAPON, AGGRAVATED ASSAULT",
    "code": 230,
    "state": "California",
    "reported": "2017-06-30T12:30:00.000Z",
    "weapons-used": {
      "description": "STRONG-ARM (HANDS, FIST, FEET OR BODILY FORCE)",
      "code": 400
    },
    "occurred": "2017-06-30T11:00:00.000Z",
    "location": "34.0567, -118.2815",
    "area": {
      "name": "Rampart",
      "id": 2
    },
    "modus-operandi": {
      "description": [
        "Aged (60 & over) or blind/crippled/unable to care for self",
        "Victim knew Suspect",
        "Choked/uses choke hold"
      ],
      "code": [
        "1202",
        "0913",
        "0408"
      ]
    },
    "city": "Los Angeles",
    "premise": {
      "description": "NURSING/CONVALESCENT/RETIREMENT HOME",
      "code": 510
    }
  }
}
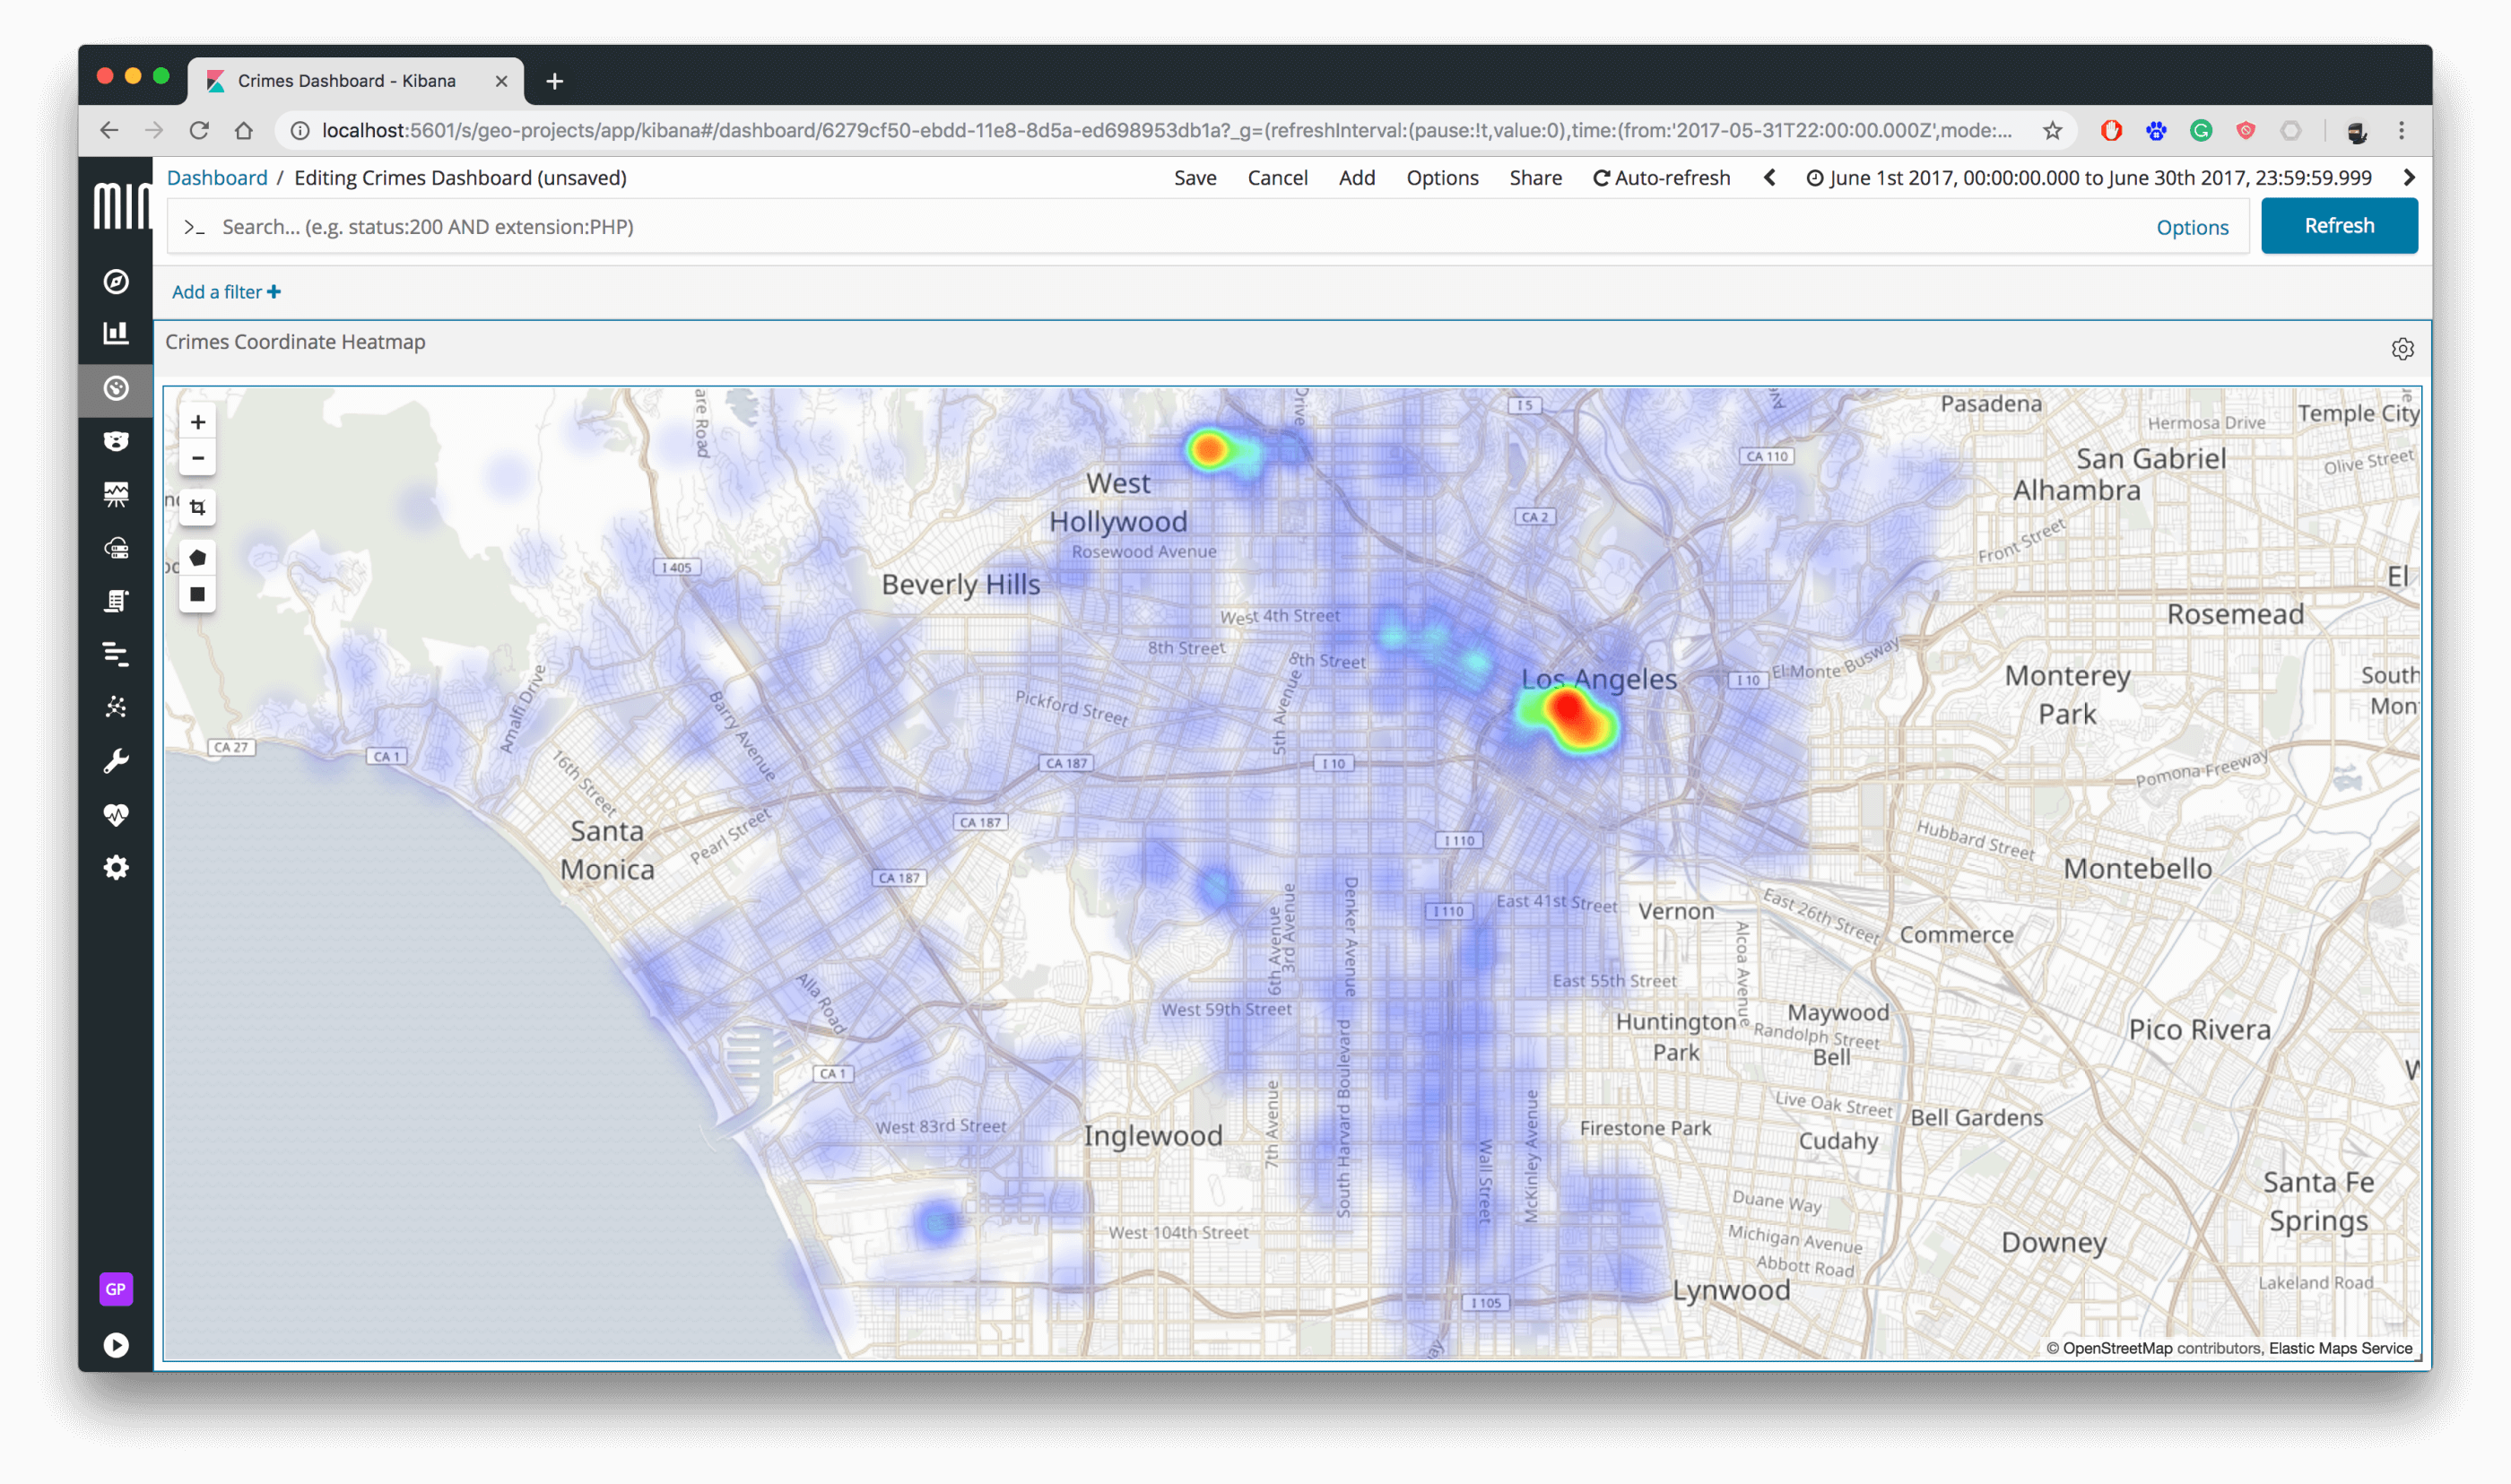
We look in June 2017. Showing all kinds of crime events, we have two hot / heat spots.
Now we filter for the victim's gender. We choose Female and Unknown. Now we get a lot more spots on the map.
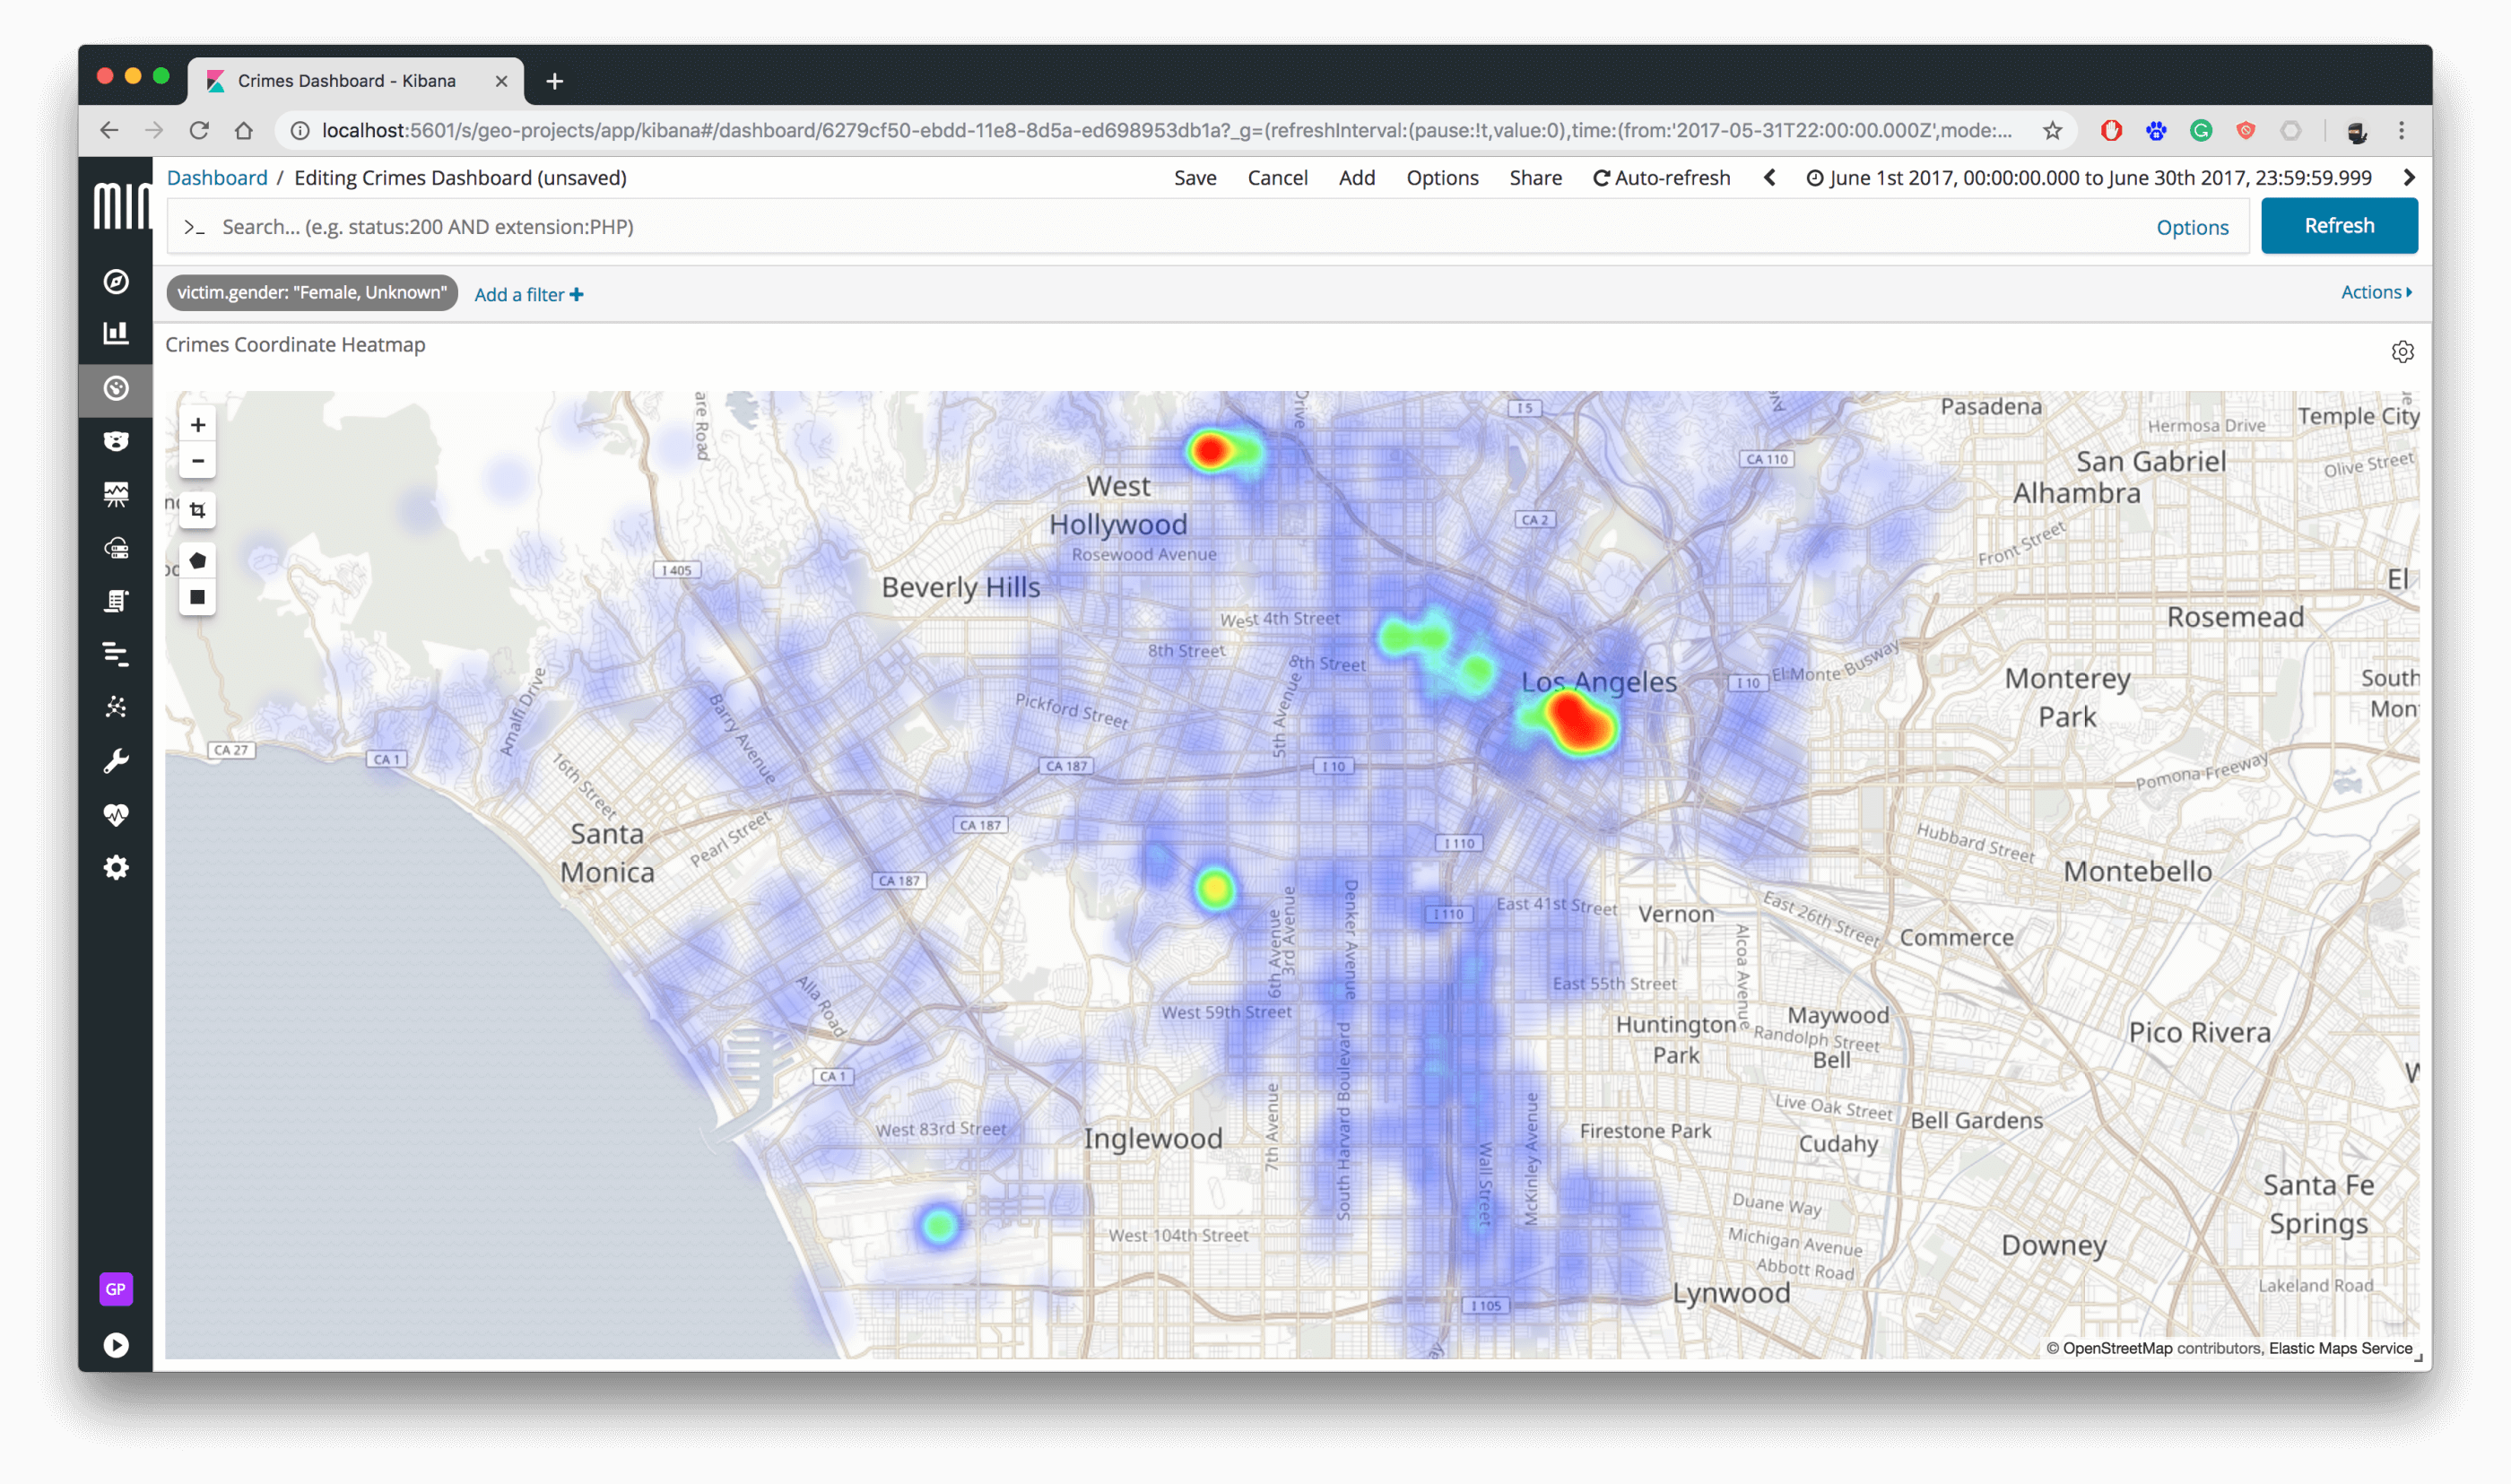
In Elasticsearch we can filter for crimes which match domestic violence. One side note: There is no excuse for domestic violence! However, it happens and data science is objective. Consider that the real or dark figure is much higher, due to the fact, that many cases don't get reported. With the data we have, we can see that from 214 cases in June 2017, roughly 75% affects women.
Live Usage
The LAPD provides the data, which is accessible on crime mapping. See below the results for the Walk of Fame in Hollywood for the last 4 weeks. Each crime type has a different symbol on the map.
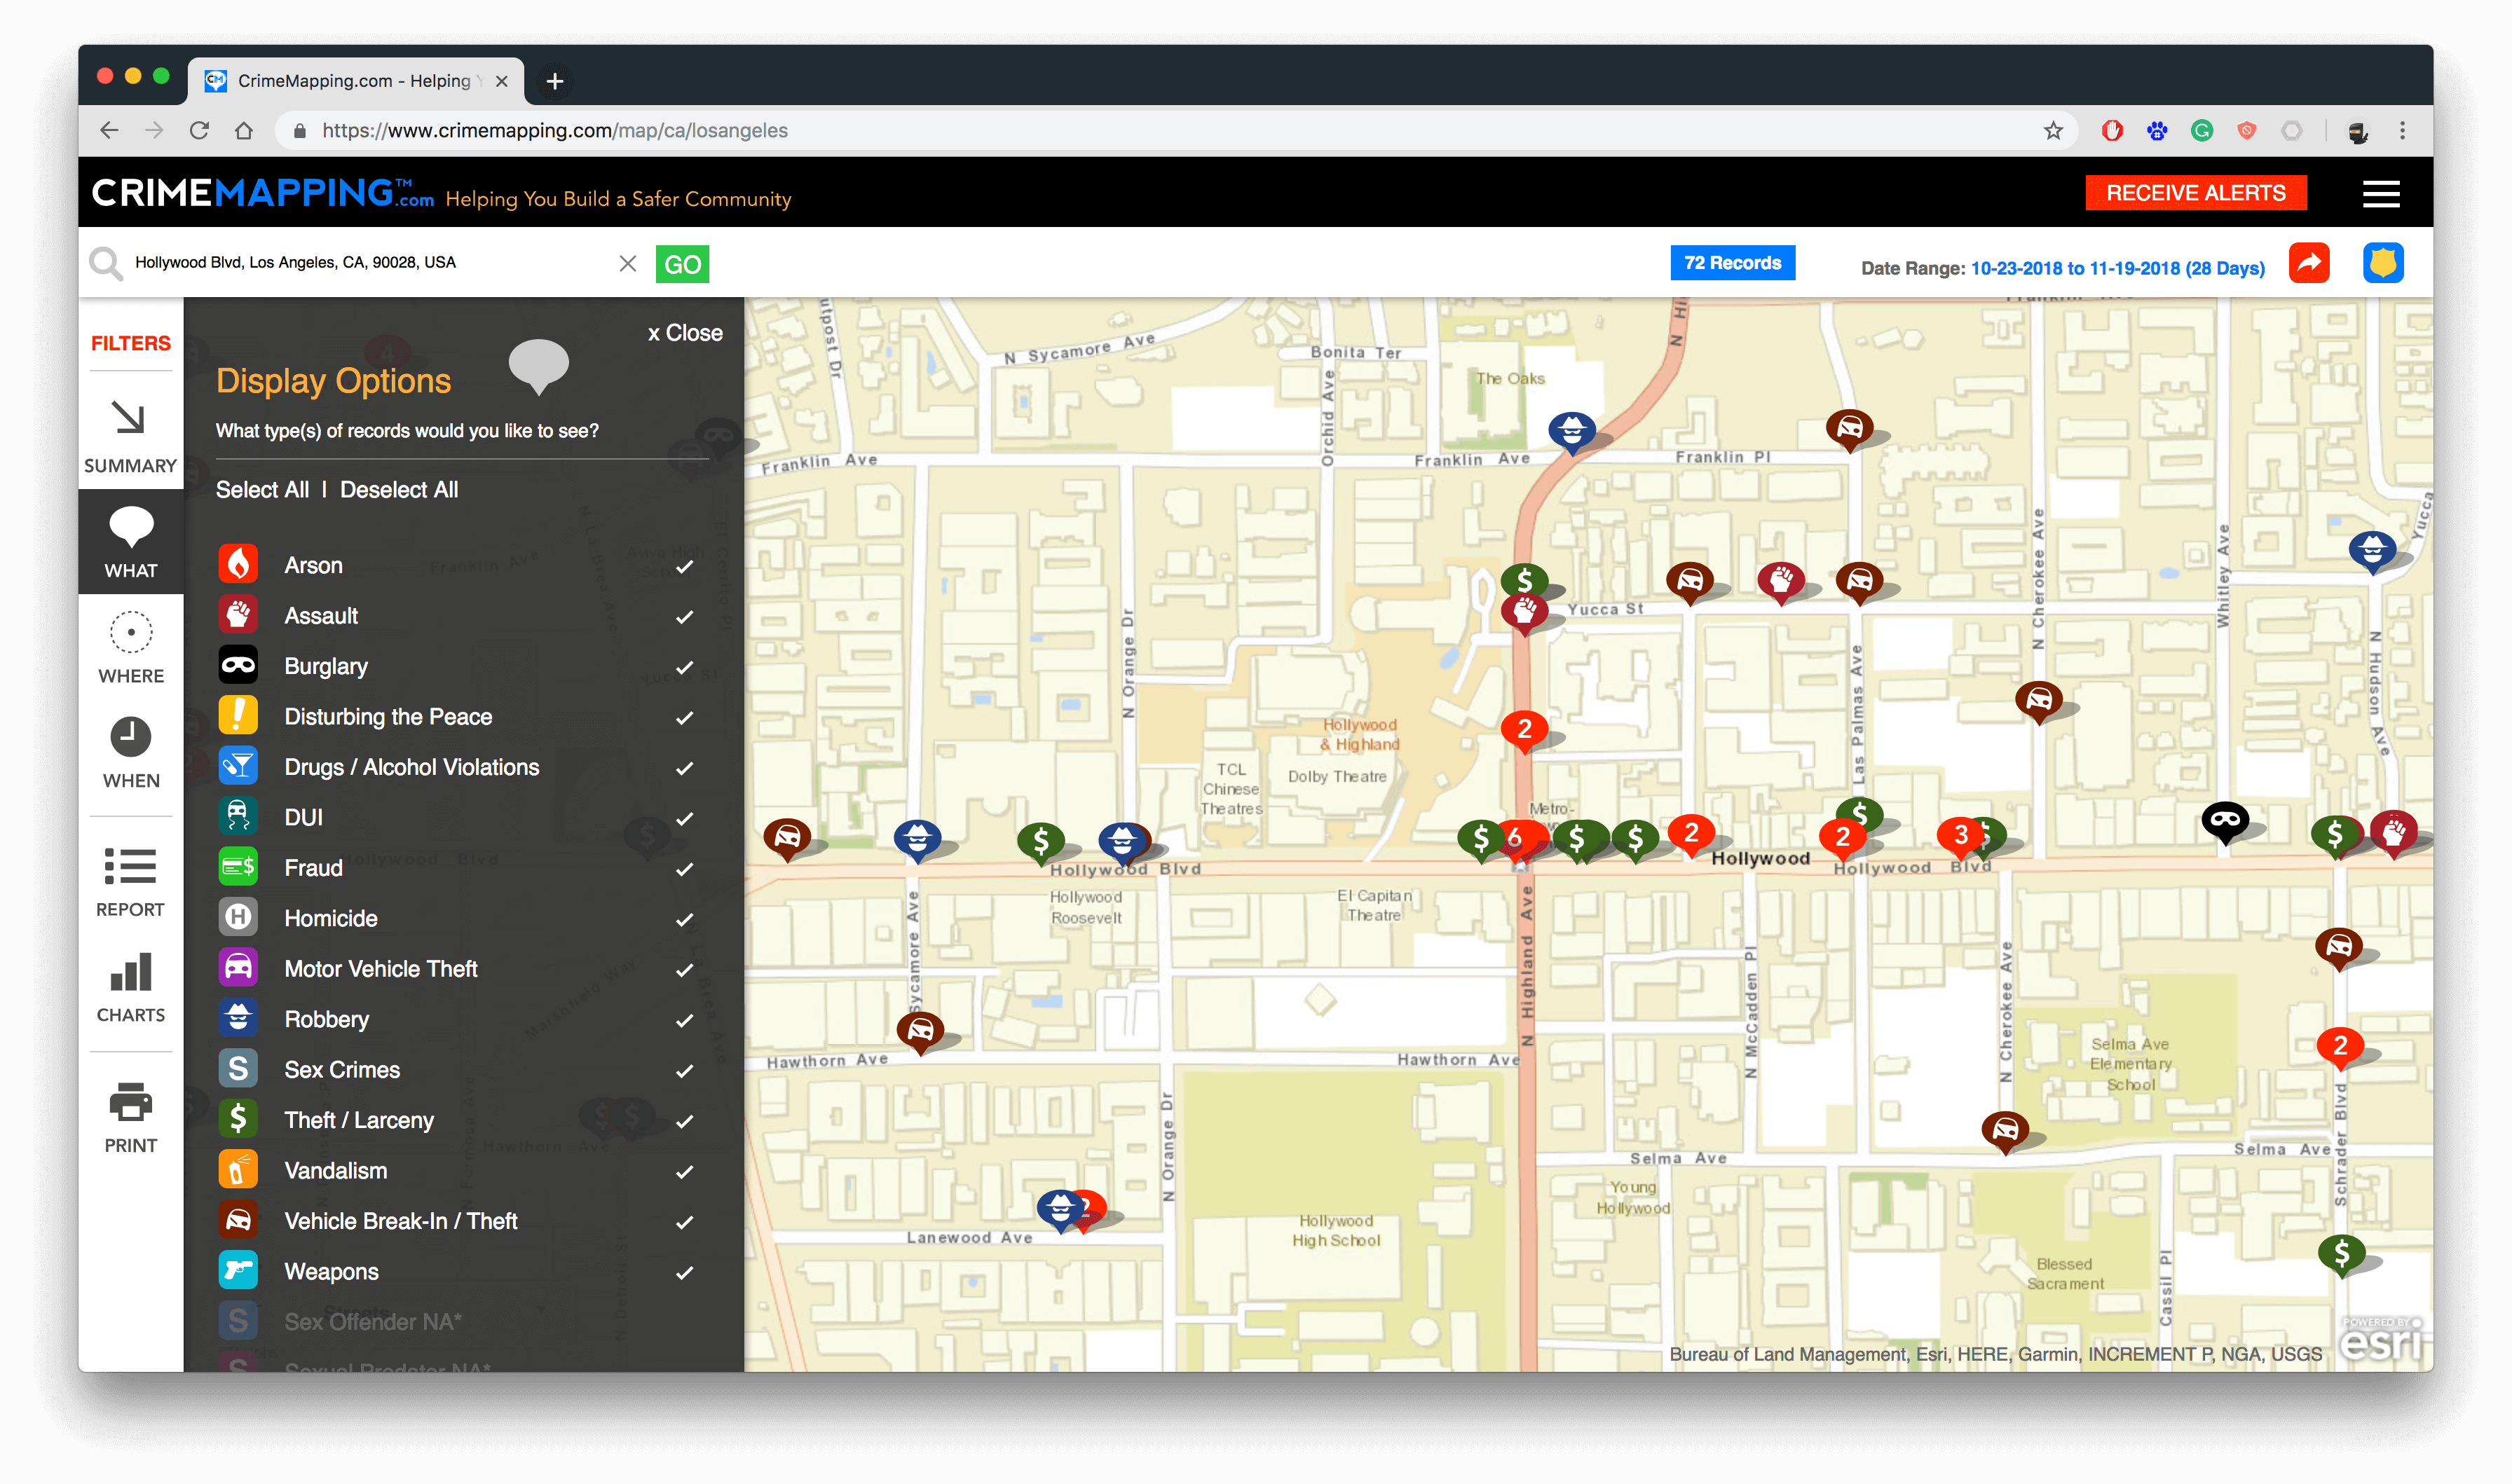
This kind of illustration is currently not possible with Kibana. Having the data in Elasticsearch, we can use other libraries to draw this kind of map.
Real Estate
Crime has an impact on property values. See below a screenshot from Neighborhood Scout for Westminster from Orange County, below LA county. This map uses a different colour scheme. You can also choose in Kibana different colour schemes.
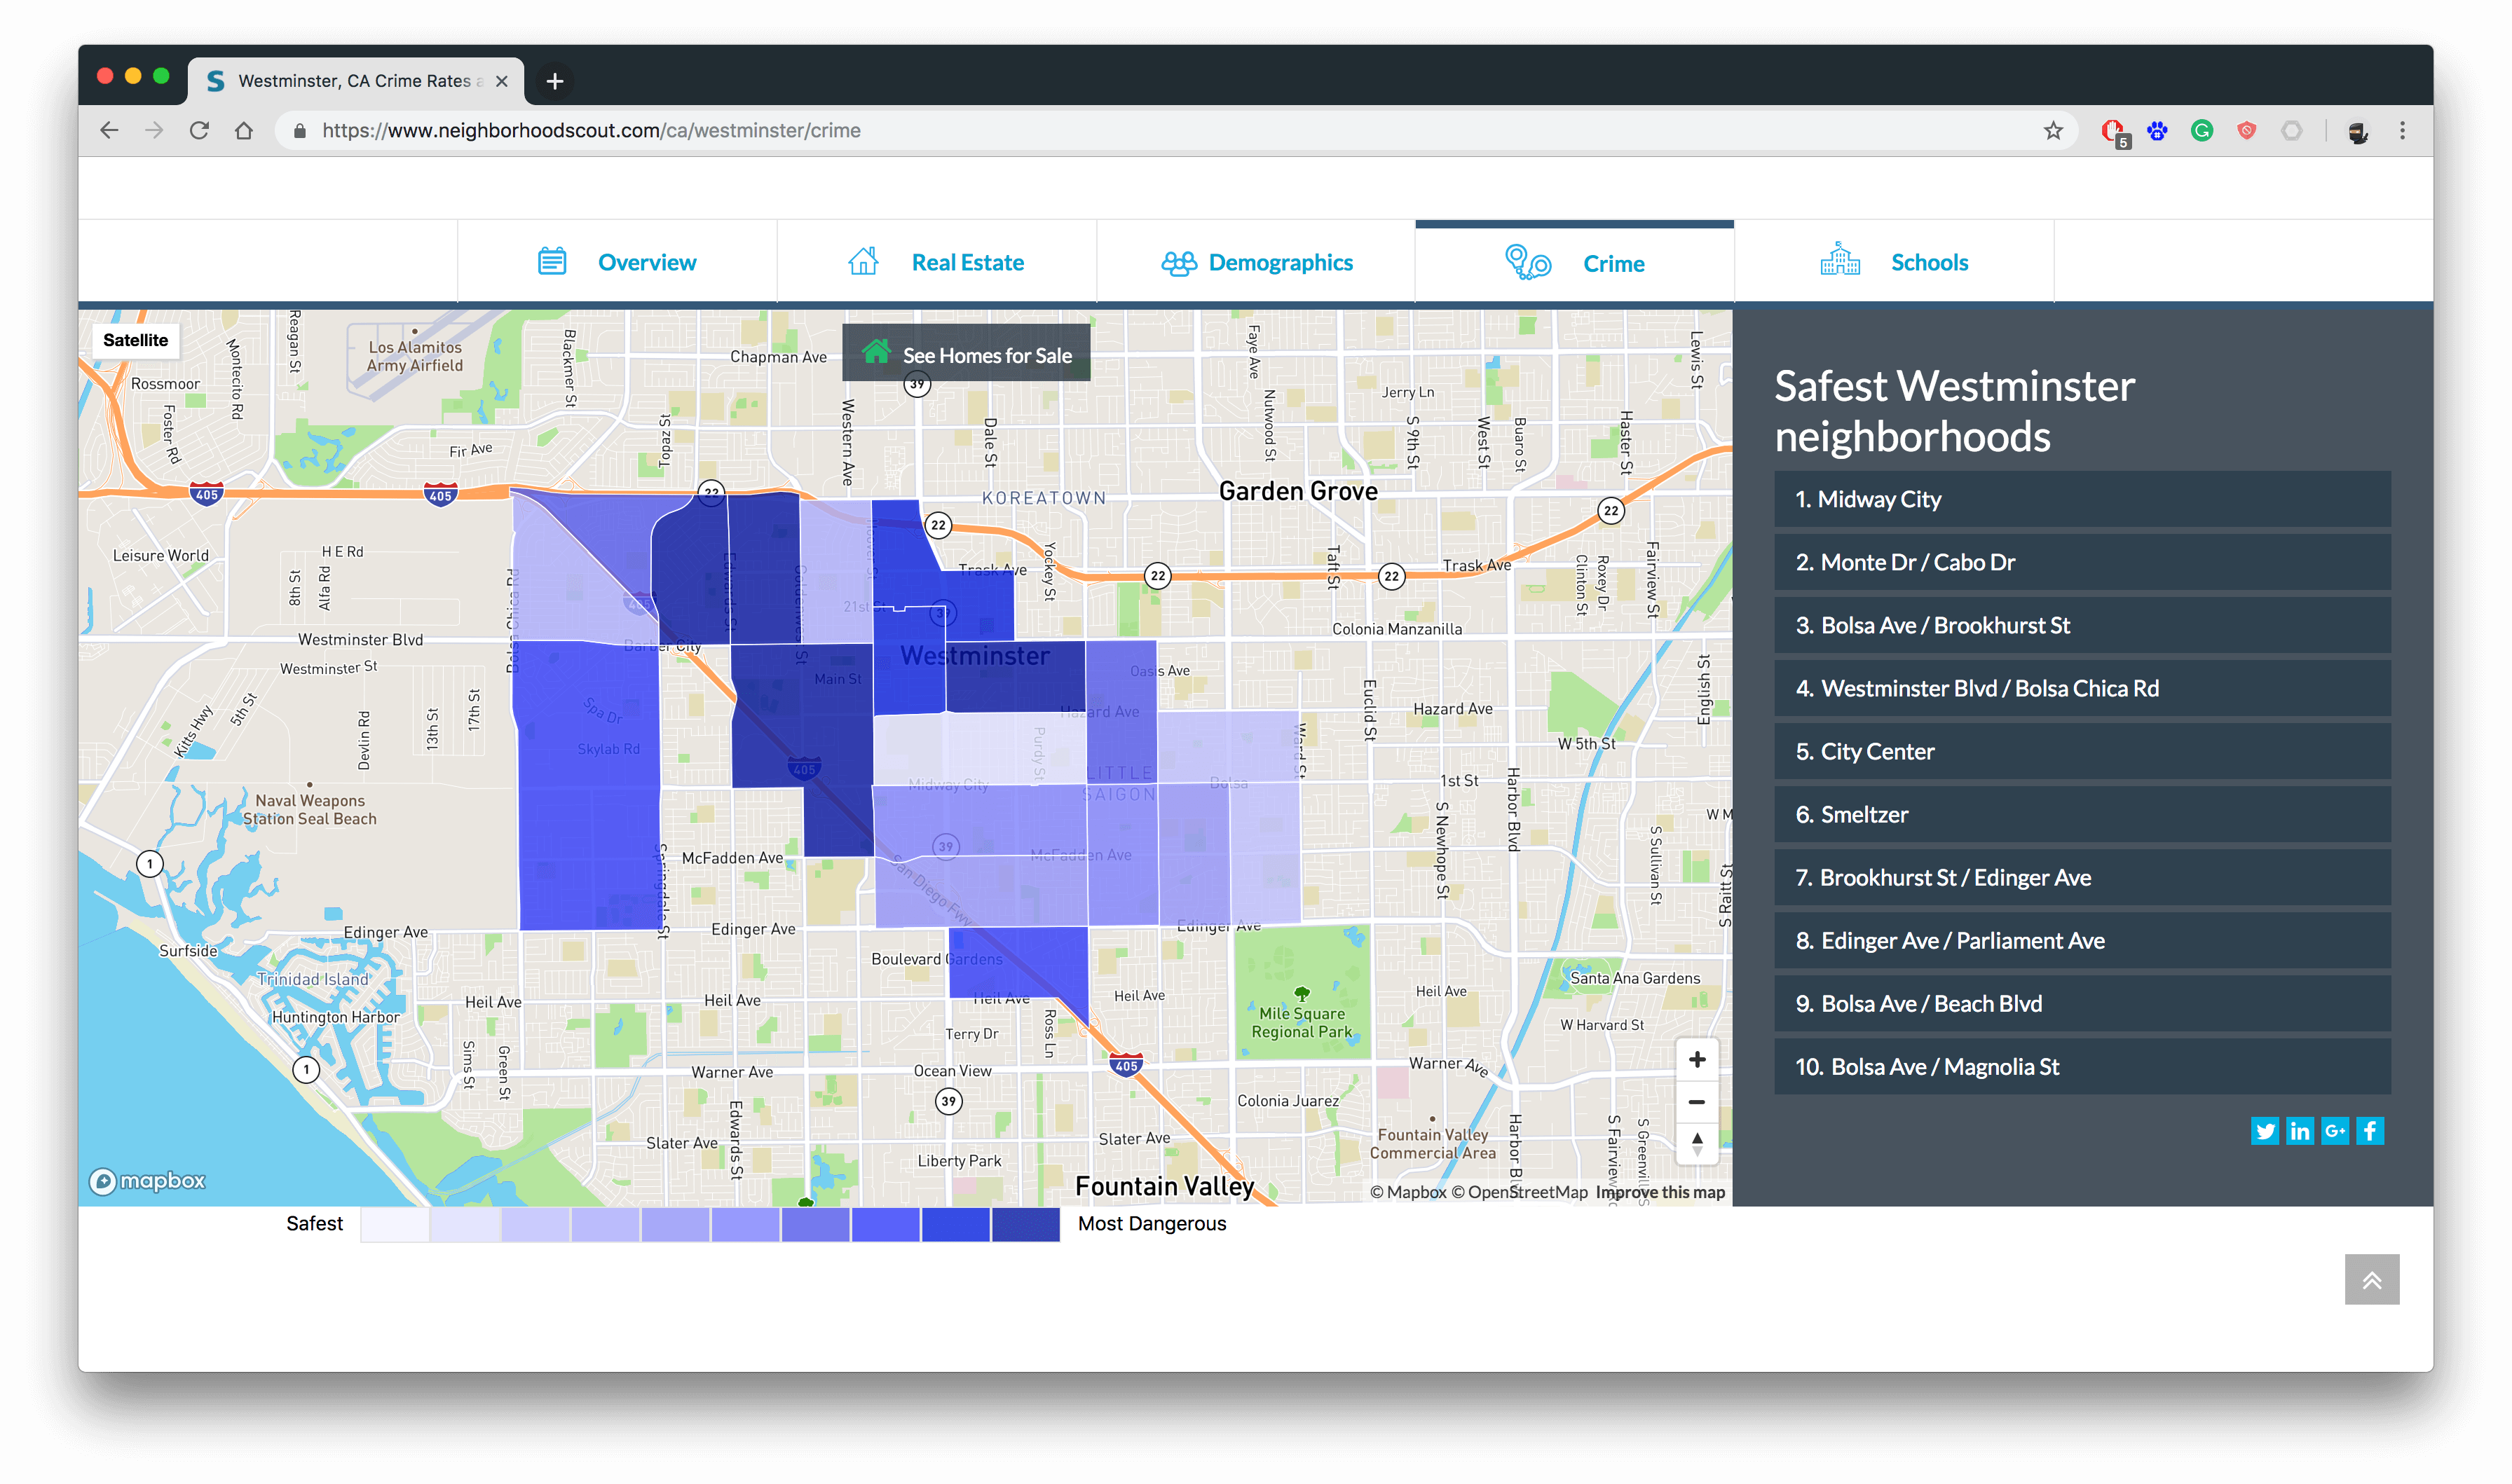
The Legend for the colours is always essential. Unhappily, we don't see them in the Kibana Coordinate Heat Map. Usually, you can combine multiple visualisations to make it more outstanding or understanding.
More Data
I have combined data sets from different cities. If I would add more major cities like Chicago, Boston, London and many more, I have to deal with one glaring problem. Each Police Department might have a different classification system for the crime. The differences from data within the same country might not differ that much.
Here comes a significant strength of Elasticsearch into play. With Advanced Search and the existing Query DSL, you can search for all theft crimes, without the need to harmonise all data in the first step. In the long run, it might be better, but to get started and have a glimpse of data, Elasticsearch is pretty awesome.
We search for all theft crimes as terms aggregations. In the should clause I add some synonyms, in case the crime has no theft word. I have aggregated the results per country to distinguish the data from Vancouver and Los Angeles.
GET crimes*/_search
{
  "size": 0,
  "query": {
    "bool": {
      "must": [
        {
          "match": {
            "description": "theft"
          }
        }
      ],
      "should": [
        {
          "match": {
            "description": "robbery"
          }
        },
        {
          "match": {
            "description": "steal"
          }
        }
      ]
    }
  },
  "aggs": {
    "crime_per_countries": {
      "terms": {
        "field": "country"
      },
      "aggs": {
        "theft_crimes": {
          "terms": {
            "field": "description.keyword",
            "size": 25
          }
        }
      }
    }
  }
}
The response gives us for the
- USA = 424'820 theft crimes from 2010 to 2017
- Canada = 289'015 theft crimes from 2003 to 2017
{
  "took" : 187,
  "hits" : {
    "total" : 713835
  },
  "aggregations" : {
    "crime_per_countries" : {
      "doc_count_error_upper_bound" : 0,
      "sum_other_doc_count" : 0,
      "buckets" : [
        {
          "key" : "USA",
          "doc_count" : 424820,
          "theft_crimes" : {
            "doc_count_error_upper_bound" : 0,
            "sum_other_doc_count" : 19,
            "buckets" : [
              {
                "key" : "THEFT PLAIN - PETTY ($950 & UNDER)",
                "doc_count" : 113709
              },
              {
                "key" : "THEFT OF IDENTITY",
                "doc_count" : 100653
              },
              {
                "key" : "THEFT FROM MOTOR VEHICLE - PETTY ($950 & UNDER)",
                "doc_count" : 63995
              },
              {
                "key" : "THEFT-GRAND ($950.01 & OVER)EXCPT,GUNS,FOWL,LIVESTK,PROD0036",
                "doc_count" : 56377
              },
              {
                "key" : "SHOPLIFTING - PETTY THEFT ($950 & UNDER)",
                "doc_count" : 35032
              },
              {
                "key" : "THEFT FROM MOTOR VEHICLE - GRAND ($400 AND OVER)",
                "doc_count" : 22588
              },
              {
                "key" : "THEFT, PERSON",
                "doc_count" : 10326
              },
              {
                "key" : "EMBEZZLEMENT, GRAND THEFT ($950.01 & OVER)",
                "doc_count" : 5811
              },
              {
                "key" : "BUNCO, GRAND THEFT",
                "doc_count" : 5100
              },
              {
                "key" : "BUNCO, PETTY THEFT",
                "doc_count" : 3191
              },
              {
                "key" : "SHOPLIFTING-GRAND THEFT ($950.01 & OVER)",
                "doc_count" : 2673
              },
              {
                "key" : "DEFRAUDING INNKEEPER/THEFT OF SERVICES, $400 & UNDER",
                "doc_count" : 1709
              },
              {
                "key" : "THEFT PLAIN - ATTEMPT",
                "doc_count" : 1311
              },
              {
                "key" : "THEFT FROM MOTOR VEHICLE - ATTEMPT",
                "doc_count" : 934
              },
              {
                "key" : "EMBEZZLEMENT, PETTY THEFT ($950 & UNDER)",
                "doc_count" : 462
              },
              {
                "key" : "THEFT FROM PERSON - ATTEMPT",
                "doc_count" : 223
              },
              {
                "key" : "DEFRAUDING INNKEEPER/THEFT OF SERVICES, OVER $400",
                "doc_count" : 170
              },
              {
                "key" : "THEFT, COIN MACHINE - PETTY ($950 & UNDER)",
                "doc_count" : 168
              },
              {
                "key" : "DISHONEST EMPLOYEE - GRAND THEFT",
                "doc_count" : 125
              },
              {
                "key" : "DISHONEST EMPLOYEE - PETTY THEFT",
                "doc_count" : 100
              },
              {
                "key" : "GRAND THEFT / INSURANCE FRAUD",
                "doc_count" : 63
              },
              {
                "key" : "THEFT, COIN MACHINE - GRAND ($950.01 & OVER)",
                "doc_count" : 33
              },
              {
                "key" : "PETTY THEFT - AUTO REPAIR",
                "doc_count" : 19
              },
              {
                "key" : "THEFT, COIN MACHINE - ATTEMPT",
                "doc_count" : 17
              },
              {
                "key" : "GRAND THEFT / AUTO REPAIR",
                "doc_count" : 12
              }
            ]
          }
        },
        {
          "key" : "Canada",
          "doc_count" : 289015,
          "theft_crimes" : {
            "doc_count_error_upper_bound" : 0,
            "sum_other_doc_count" : 0,
            "buckets" : [
              {
                "key" : "Theft from Vehicle",
                "doc_count" : 172700
              },
              {
                "key" : "Other Theft",
                "doc_count" : 52167
              },
              {
                "key" : "Theft of Vehicle",
                "doc_count" : 38418
              },
              {
                "key" : "Theft of Bicycle",
                "doc_count" : 25730
              }
            ]
          }
        }
      ]
    }
  }
}
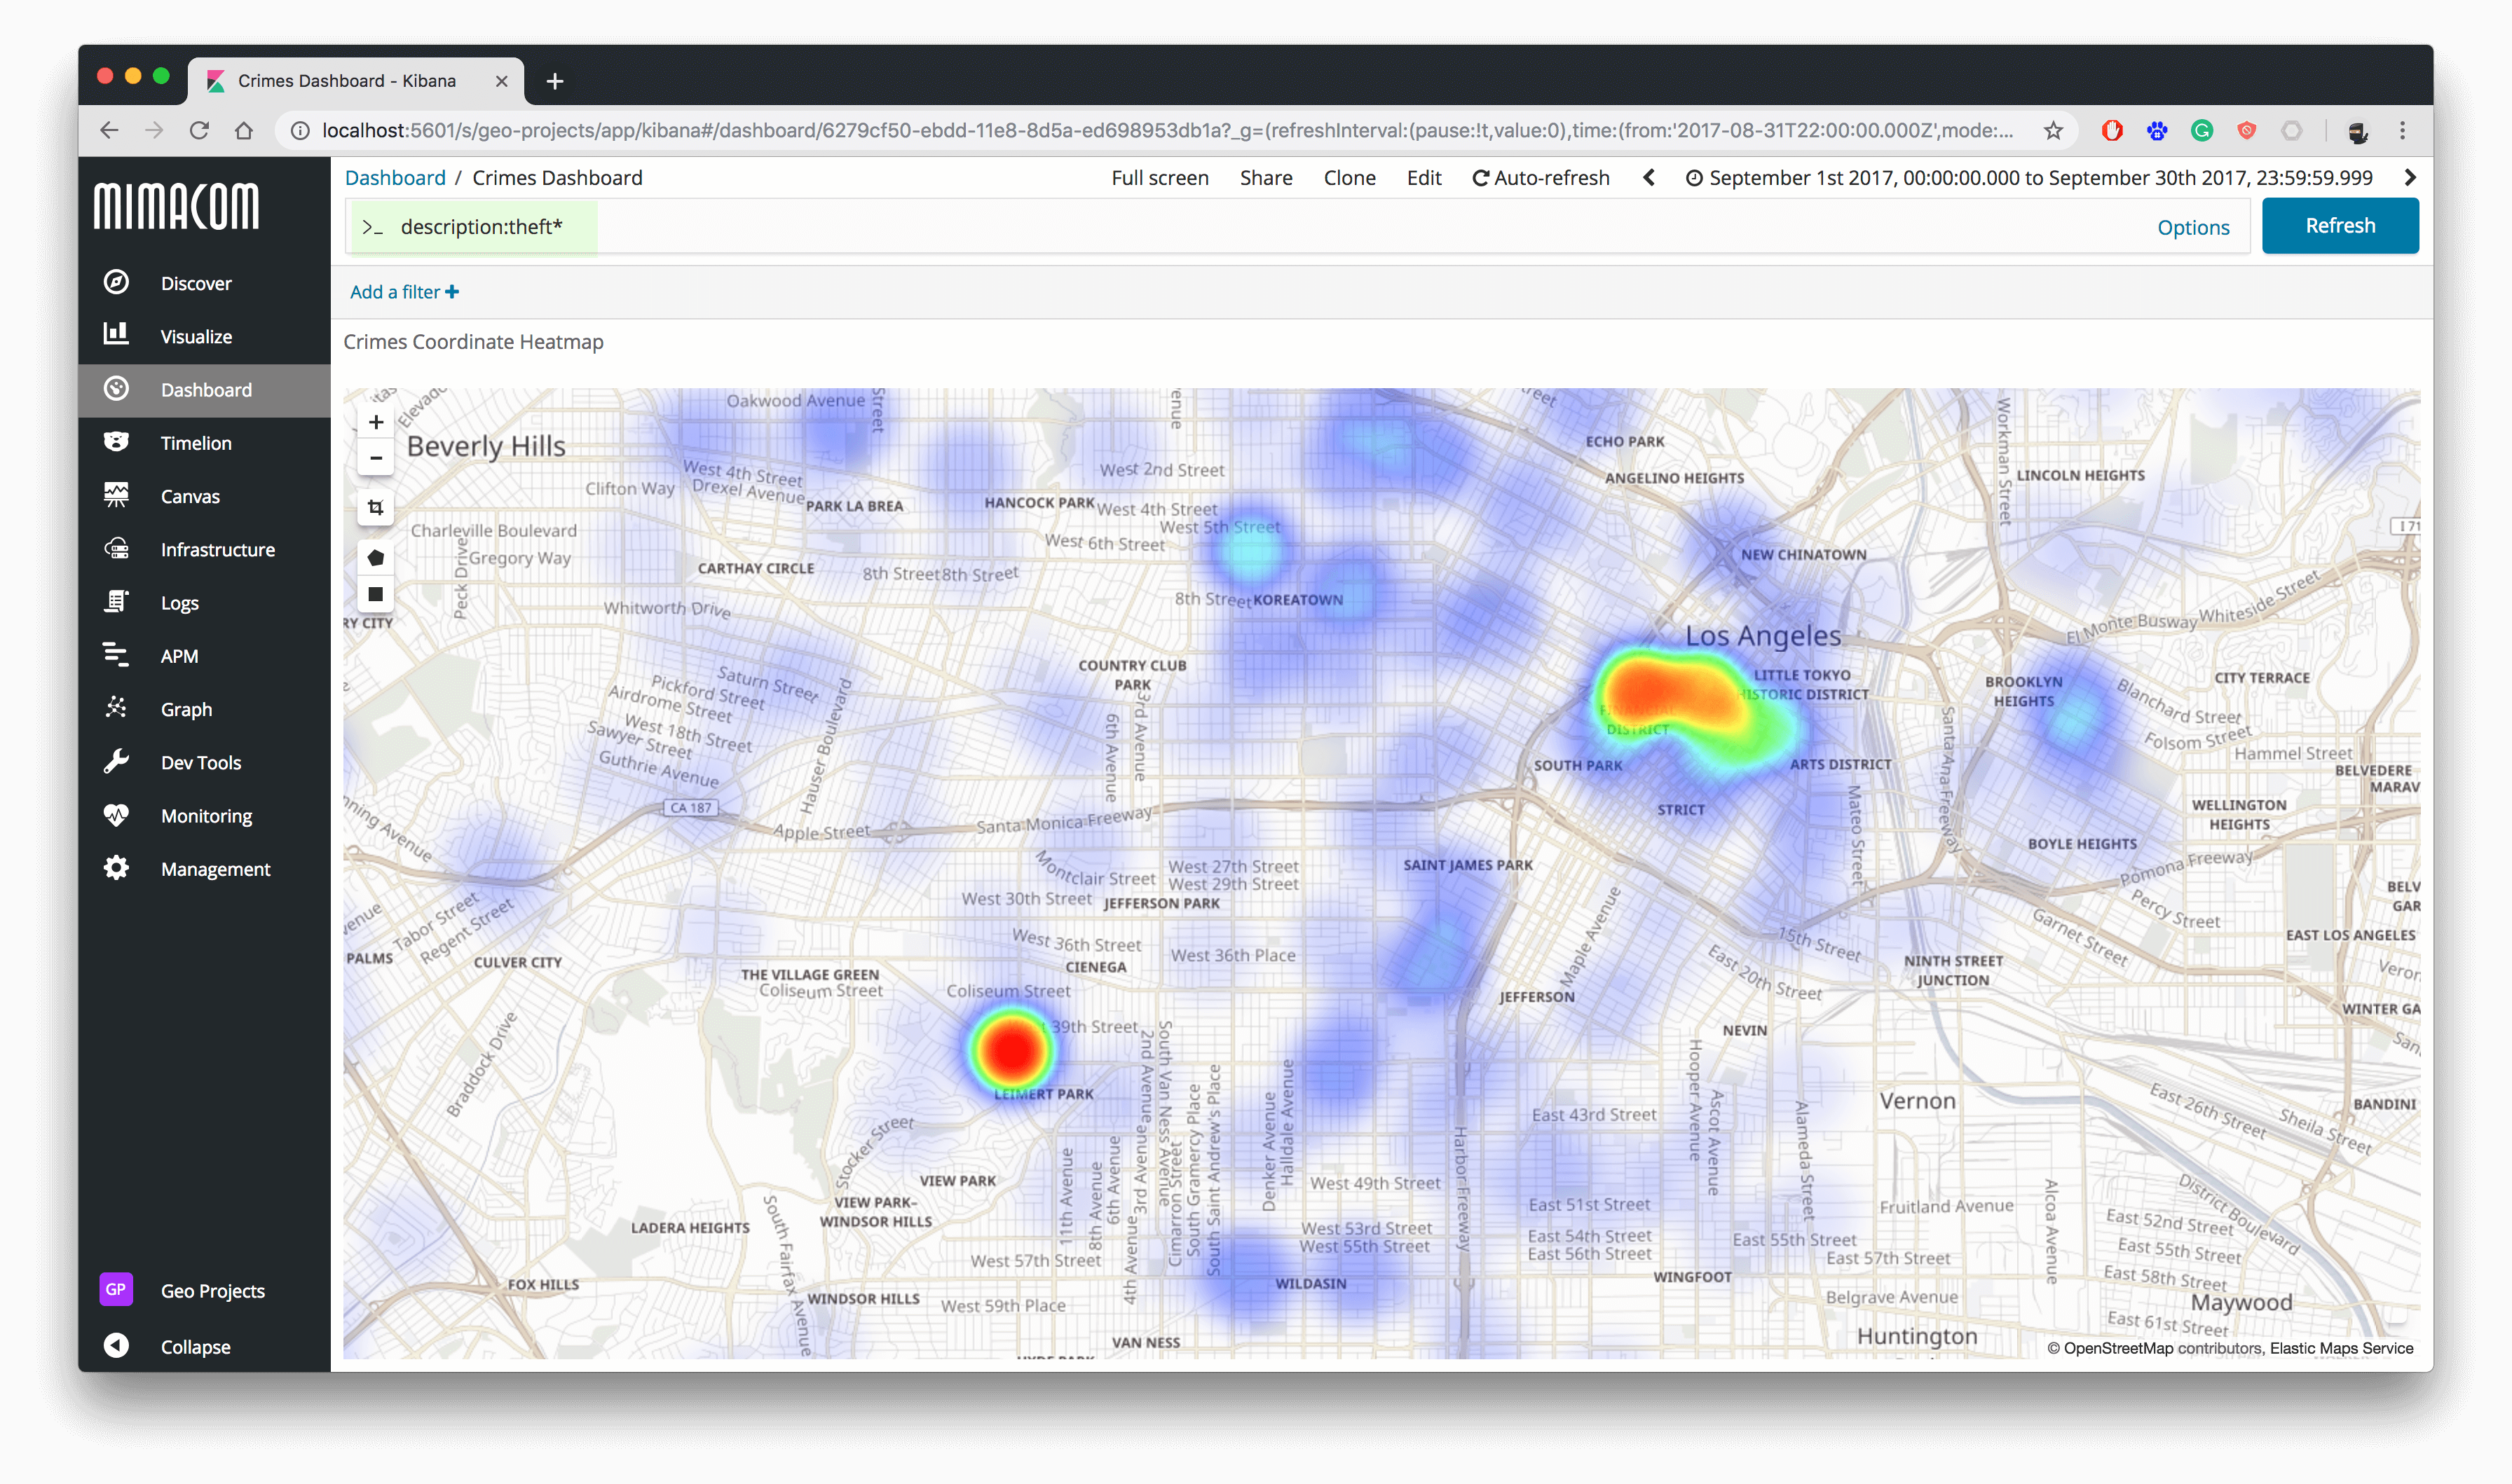
Noteworthy to mention, this might be a typical question for the Certified Elastic Engineer exam. In the future, the Elastic training offers specialisation paths like the Elasticsearch Advanced Search Specialization or Data Science to deal with this kind of situations. Above example also works for Kibana. In the following screenshot you see the theft query for September 2017.
Traffic and IoT
In this article, I illustrated how to use Kibana Heat Map charts and Coordinate Maps for crime data. You could use that for traffic accidents or any other eligible area, where you need to illustrate different densities.
Let's assume you exchange IoT (Internet of Things) data from traffic cameras. With this data, you are capable of rendering traffic density maps as shown in the following picture from Google.

Summary
Originally I wanted to move on in the next article to serving custom maps for Kibana with the Open Source GeoServer. However, after a talk with Nadine Piveteau, I realised how fulfilling it could be, to talk with passionate engineers or GIS experts. It is like to unwrap a loving Christmas present.
I am going to quote her briefly in her essence:
The article is pretty straightforward and contains static snapshots. As GIS consultant I would find it very exciting if we could dynamically investigate a whole year or day. We take all the heat map snapshots and combine them it into an animated Gif. This way we can show development and layout at what time which areas or neighbourhoods were dangerous.
Above idea was only one of many original ideas. If you feel you got stuck, it helps to exchange ideas and ask for advice. My reaction to that: You had me at hello (world).
In the next article, we are going to execute the above suggestion and may introduce with it a little bit of pattern recognition. A little bit more advanced, but we try to remain understandable.