Taking Time-series Analysis with Elasticsearch to Production
Introduction
The main goal of using the machine learning tool available with the elastic stack is extracting the maximum value from the information we index. Thus far, we've been able to obtain page views with real time searches or perform data aggregations, but now machine learning allows us to address more particular behaviour and have more specific visualizations using learning techniques.
The general goal is to detect anomalies in information time series. The system will learn what normal behaviour is, forming a pattern. When values stray from this behaviour, an anomaly will be reported. This is done by building a probabilistic model as the system learns. The idea of using a probabilistic system over a static rules system, will reduce the number of false positives.
Use Cases
There are several use cases for the elastic machine learning module. The most common could be:
- Response Codes - Analysing response codes to detect service errors
- CPU metrics - Analysing CPU service overload
- Suspicious processes - Detecting unusual endpoints in a server
- Access analysis - Seeing volumes of user access to an application
- DNS spoofing - Preventing DNS information spoofing attacks
And what benefits can we obtain with this module?
For instance, we can highlight capacity planning (perform an estimation of the occupied/free space), system overload (estimate critical system overload points) and the study of fast response times (analyse the response metrics to detect problems with services).
Alerts
When a machine learning job is configured, it is possible to scan the type of anomaly that occurs. The different types are low, warning and critical, depending on the temporal comparison with learning acquired in past executions. Alerts are a strong point of anomalies analysis. Email alerts can be configured (in addition to webhooks invocation and multiple other third-party integrations) when a specific type of anomaly occurs on the job, meaning that immediate action can be taken to deal with any type of problem.
Forecasts
The new on-demand forecasts feature has been added to x-pack version 6.1 onwards. It can be used to forecast the type of behaviour in the next few days. Elasticsearch stores these forecasts in the same machine learning job index to subsequently compare them with the actual behaviour.
Machine Learning for logs on a real production system
We are going to detail the study for a customer concerning two cases in their productive systems below.
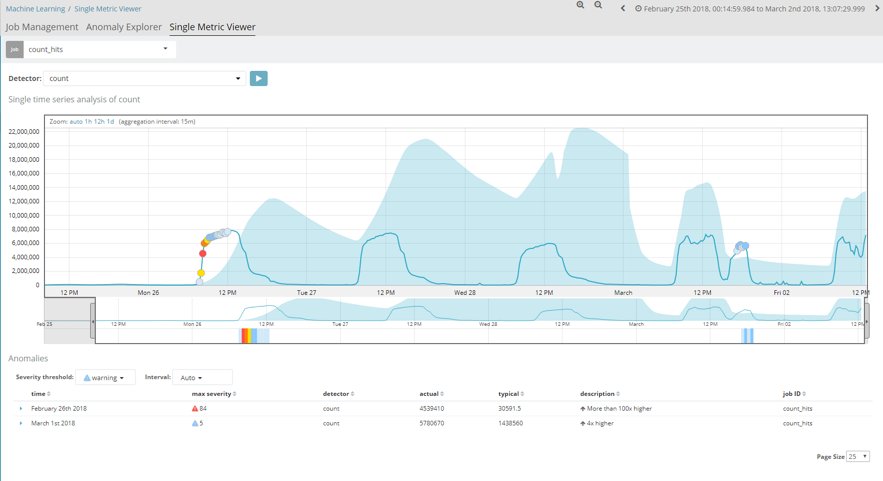
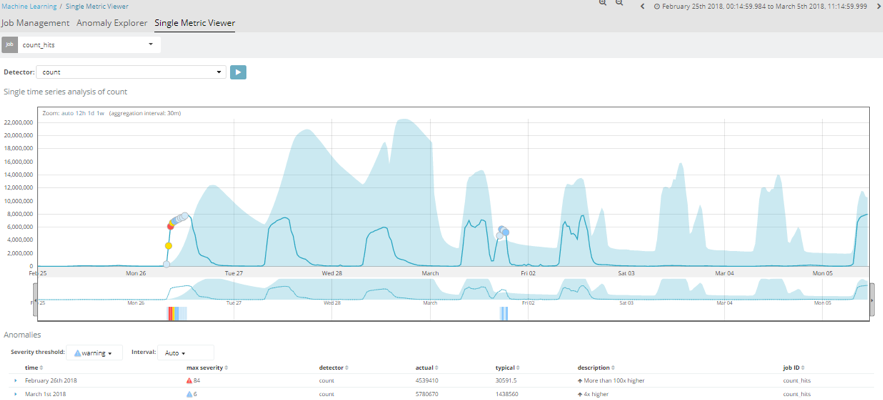
The first of these, would be an analysis of the number of hits per temporal space. This job essentially displays a graph with the number of documents stored in an index. The analysis is performed with a 15-minute interval and, as we can observe, presents a more or less uniform pattern.

When a machine learning job is first created, the first iteration is never consistent, as it has no previous information with which to compare the values it begins to receive.
The blue strip in the image shows the trend of this job's pattern. As time passes, and the job acquires further information, we can see how this strip ends up being pretty close to the actual values, as learning is already highly advanced.

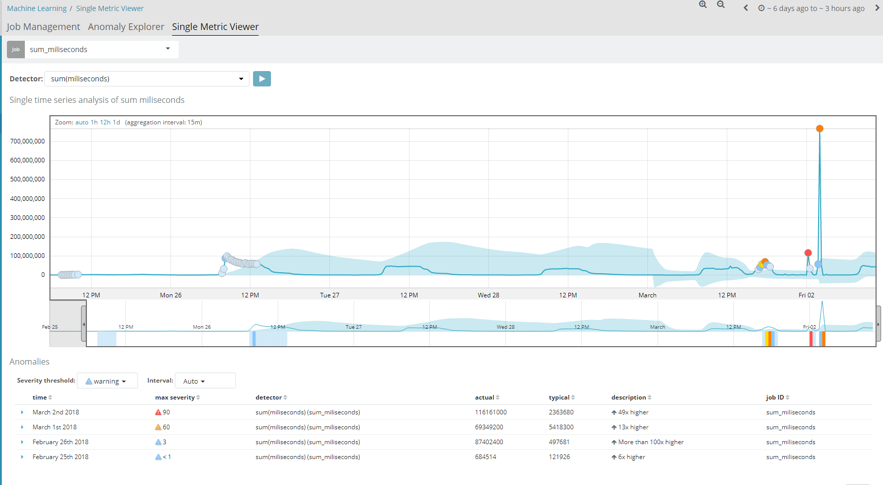
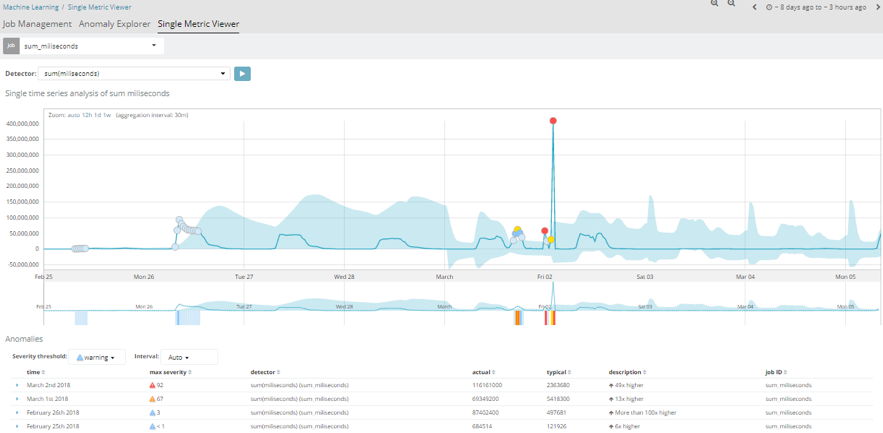
Another case studied is the millisecond response time of the different applications. In this instance, we can see that it also follows a uniform pattern, as was the case in the first example. However, if we take a closer look, several critical alerts occurred on 2 February. This was because a new app was released in the company that day, and services started to crash due to a deluge of requests made via the new app. Therefore, the millisecond time of each request increased significantly and exceeded their usual values.

This is a clear example of how, by using this module, we can immediately know (assisted by alerts) when abnormal behaviour takes place in our system and solve it as quickly as possible.
