Spring microservices monitoring: /metrics endpoint and ELK
Introduction
On the actual vibe of microservices using, it becomes more and more necessary to monitorize the health of our distributed systems. Here we will expose a few ways to do it, concentrating us in Spring boot applications. Hands on!
Current tools available
On the ELK community already exist two easy solutions to poll for the /metrics endpoint – the Logstash Http_poller input plugin and the community beat springbeat. Both work on a similar way (configure a URL and voilá! data is forwarded to Elasticsearch) but in different contexts, the former is a plugin part of Logstash, while the latter is an independent beat application. And both seem to be nice options, if we want to know the state of microservices with a defined URL or a single instance or if we use a service discovery with a gateway pattern, i.e. zuul+Eureka. And both share the same limitation: There is no way to configure service discovery to poll for all the instances of a service (As of now…). Whether or not this limitation is a problem, depends on what we want and what we have. Do we have a single instance of each microservice? or if we have multiple instances, do we want to know the general aggregated state of them? (I would put an alarm here, because some data is tightly coupled to the instance or it’s JVM and aggregating it might be a problem). An option to solve this limitation is to write a little client, a Spring boot application that will use the service discovery provided by Spring Cloud Eureka to get all the instances, poll them, process data, and forward it to the ELK stack.
Solution Part 1 – The discovery client
The idea for this point is to use a job-scheduled Spring boot application, which will be polling Eureka for instances of our microservices, and after that it will poll for the /metrics endpoint of each reported instance.
So, getting all the services registered in Eureka and iterating over their instances is as easy as:
application.yml
eureka:
  client:
    serviceUrl:
      defaultZone: http://localhost:8761/eureka/
  #instance Id dynamically set to allow multiple instances
  instance:
    instanceId: ${spring.application.name}:${spring.application.instance_id:${random.value}}

job:
  cron:
    expression: "*/5 * * * * *"
MetricPollerService
@Component
public class MetricPollerService {

    private static final String METRICS_ENDPOINT = "/metrics";
    private static final String EXCEPTION_MSG_KEY = "exceptionMsg";
    private static final String EXCEPTION_STACKTRACE_KEY = "exceptionStacktrace";
    private static final String ERROR_KEY = "error";
    private static final String ERROR_MESSAGE = "Instance not reachable";

    private static final Logger LOG = LoggerFactory.getLogger(MetricPollerService.class);

    private final DiscoveryClient discoveryClient;
    private final RestTemplate restTemplate;
    private final Forwarder forwarder;

    @Autowired
    public MetricPollerService(@SuppressWarnings("SpringJavaAutowiringInspection") DiscoveryClient discoveryClient, RestTemplate restTemplate, Forwarder forwarder) {
        this.discoveryClient = discoveryClient;
        this.restTemplate = restTemplate;
        this.forwarder = forwarder;
    }


    public void pollInstances() {
        //Get all the registered services
        List<String> services = discoveryClient.getServices();

        for (String service : services) {
            //Get all the instances of each service
            List<ServiceInstance> instances = discoveryClient.getInstances(service);

            LOG.info("Service:{}. Count of instances found {}", service, instances.size());

            int count = 1;
            for (ServiceInstance instance : instances) {
                LOG.debug("Processing instance #{}", count++);
                //Get the metrics and after that, operate the results
                this.getMetrics(instance);
            }
        }
    }

    @SuppressWarnings("unchecked")
    private HashMap<String, Object> getMetrics(ServiceInstance instance) {
        try {
            //use the REST template to get the metrics
            return this.restTemplate.getForObject(buildInstanceUrl(instance), HashMap.class);
        } catch (Exception ex) {
            LOG.error(MessageFormat.format("Error fetching metrics for service instance: {0} with url {1}", instance.getServiceId(), buildInstanceUrl(instance)), ex);

            HashMap<String, Object> returnValue = new HashMap<>(3);
            returnValue.put(ERROR_KEY, ERROR_MESSAGE);
            returnValue.put(EXCEPTION_MSG_KEY, ex.getMessage());
            returnValue.put(EXCEPTION_STACKTRACE_KEY, ex.getStackTrace());
            return returnValue;
        }
    }

    private static String buildInstanceUrl(ServiceInstance instance) {
        return instance.getUri() + METRICS_ENDPOINT;
    }

}
Fortunately for us, there is already a client for this on the spring-cloud-commons dependency, and using the @EnableScheduling and @Scheduled annotations, we can execute the poller periodically.
EnableSchedulingConfiguration
@Configuration
@EnableScheduling
public class EnableSchedulingConfiguration {

    private MetricPollerService metricPollerService;

    @Autowired
    publicEnableSchedulingConfiguration(MetricPollerService metricPollerService){
        this.metricPollerService = metricPollerService;
    }

    @Scheduled(cron = "${job.cron.expression}")
    publicvoidpollInstances(){
        this.metricPollerService.pollInstances();
    }
}
The format problem – results of /metrics and Elasticsearch mappings
Checking the JSON that /metrics gives us, we see something like the following:
Result of /metrics
{
"mem":412450,
"mem.free":186152,
...
"classes":15509,
"classes.loaded":15539,
"classes.unloaded":30,
...
}
While the Elasticsearch v2.X doesn’t allow dots in the names, Elasticsearch v5.0+ treats the point notation as nested documents i.e. “objects”, so the dynamic mapper finds the field “mem” and determines it is a long, and then throws an illegal_argument_exception after finding “mem.free”, since this means the “mem” requires an ObjectMapper.
Also, we can notice that there is no information regarding the microservice (ID, current port, …), hence we will need to add it in order to have it available on Elasticsearch.
Solution Part 2 – A Processor/Forwarder – The solution to the format problem
We have to fix the JSON model, and to achieve this we have 2 options:
a) Remove the dots of the field names, hence making Elasticsearch to treat them as a single document, instead of nested documents, using the Logstash’s de_dot filter.
b) Normalize the fields, i.e. remove the “roots” and make their value part of an object, e.g. “mem”:412450 -> “mem.value”:412450, and then forward the data to Elasticsearch
In this post, we will focus on the solution b) because we saw a scary “It should only be used if no other options are available.” note on the de_dot filter docs, (and, you know, coding is fun :D ).
For this, we will delegate the process of the metrics to another class (and we will add the required metadata :))
ElasticsearchForwarder
@Component

public class ElasticsearchForwarder implements Forwarder {

    private staticfinalLogger LOG = LoggerFactory.getLogger(ElasticsearchForwarder.class);
    private staticfinalString DEFAULT_DATE_FORMAT = "yyyyMMdd'T'HHmmss.SSSZ";

    private staticfinalString POSFIX = ".value";
    private staticfinalString META_KEY_TIMESTAMP = "timestamp"+ POSFIX;
    private staticfinalString META_KEY_HOST = "host"+ POSFIX;
    private staticfinalString META_KEY_PORT = "port"+ POSFIX;
    private staticfinalString META_KEY_SVC_ID = "serviceId"+ POSFIX;

    privatefinalGson gson = newGson();


    privateString buildMessageFromMetrics(HashMap<String, Object> metrics, ServiceInstance instance) {
        HashMap<String, Object> jsonKeyValueMap = new HashMap<>();

        metrics.forEach((key, value) -> jsonKeyValueMap.put(key + POSFIX, value));

        //Adding the metadata not present on the /metrics reponse
        SimpleDateFormat simpleDateFormat = newSimpleDateFormat(DEFAULT_DATE_FORMAT);
        jsonKeyValueMap.put(META_KEY_TIMESTAMP, simpleDateFormat.format(newDate()));
        jsonKeyValueMap.put(META_KEY_HOST, instance.getHost());
        jsonKeyValueMap.put(META_KEY_PORT, instance.getPort());
        jsonKeyValueMap.put(META_KEY_SVC_ID, instance.getServiceId());

        returnthis.gson.toJson(jsonKeyValueMap);
    }
}
In order to forward the data to Elasticsearch, we use the provided official client, present on the dependency:
Elasticsearch client dependency
<dependency>
    <groupId>org.elasticsearch.client</groupId>
    <artifactId>rest</artifactId>
    <version>5.1.1</version>
</dependency>
We create the bean for the Elasticsearch REST Client
MicroSvcPollerApplication
@Bean
RestClient restClient(@Value("${elasticsearch.host}") String elasticsearchHost, @Value("${elasticsearch.port}") intport) {
    returnRestClient.builder(newHttpHost(elasticsearchHost, port)).build();
}
And then we wire it in, exposing a method for the MicroSvcPoller.java to be able to ship the data.
ElasticsearchForwarder
//Elasticsearch rest client
private final RestClient esRestClient;
    @Autowired
    public ElasticsearchForwarder(RestClient esRestClient) {
        this.esRestClient = esRestClient;
    }

    public void submit(HashMap<String, Object> message, ServiceInstance instance) {
        String jsonContent = this.buildMessageFromMetrics(message, instance);
        HttpEntity entity;

        try{
            entity = newNStringEntity(jsonContent);
        } catch(UnsupportedEncodingException e) {
            throw new RuntimeException("Error converting string entity from Json String", e);
        }

        esRestClient.performRequestAsync("POST", "/microsvcmetrics/metrics", Collections.emptyMap(), entity, newResponseListener() {
            @Override
            publicvoid onSuccess(Response response) {
                LOG.debug("Successfully submitted metrics");
            }

            @Override
            public void onFailure(Exception exception) {
                LOG.error("Error submitting metrics",exception);
            }
        });
    }
Changes to MicroSvcPoller
...
public void pollInstances() {
    ...
     //Get the metrics and after that, operate the results
    this.forwarder.submit(this.getMetrics(instance), instance);
    ...
}
Preparing the Elasticsearch Index
We will take advantage of the dynamic mapping of Elasticsearch, so we will just define one mapping: the timestamp, to make easier the analysis with Kibana. So, start your Elasticsearch and Kibana instances, and do:
Definition of the Elasticsearch mappings
PUT microsvcmetrics

{
  "settings": {
    "index": {
      "number_of_shards": 1,
      "number_of_replicas": 1
    }
  },
  "mappings": {
    "metrics": {
      "properties": {
        "timestamp.value": {
          "type": "date",
          "format": "yyyyMMdd'T'HHmmss.SSSZ"
        }
      }
    }
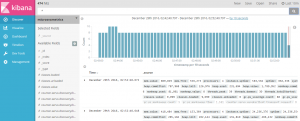
Execute the poller and that’s it! now we have our data indexed in Elasticsearch
Conclusion
We were able to fetch all the instances of all the services known by an instance of Eureka, and to forward the result of the /metrics endpoint of each one of them to Elasticsearch for them to be analyzed. Next steps and open questions: is there another tool that makes this task easier? How can we be aware ASAP of the issues reflected by the data? how can we improve the processing of the result of the /metrics end point? how could we improve the indexing of the data on Elasticsearch? We will keep going with these topics in the next chapter!
The full code for this project is available at https://github.com/mimacom/metric-forwarder
Enrique Llerena Domínguez
mimacom DE
mimacom dot com (enrique dot dominguez @)
Twitter: @ellerenad