Tableau and Shiny Reports Integration Into Liferay
In this blog we will demonstrate, how to integrate two interactive report resources into a web application environment like Liferay. There are some benefits to do so like gathering all reports from different servers into a portal to be accessed as well as leveraging Liferay governance controls on them.
Tableau and Shiny servers provide interactive reports on top of R language where the former applies R language to leverage its out-of-box data processing features and the later completely builds the application in R environment. To know more about Tableau and Shiny please refer to their own official websites Tableau and Shiny. We write it in two posts, in the first one we are going to suppose, there is a Tableau report in place which is hosted by a Tableau server (online public Tableau sample), then will try to load it in a custom Liferay Portlet. In the coming next post, we will go with a Shiny application (some R and JavaScript) to make it ready to be loaded in a Liferay portlet. There may not be any reason to compare Tableau and Shiny reports but from embedding them inside a web environment like Liferay point of view, there is one major difference. Tableau server provides a JavaScript API to load a report which gives plenty of control commands over the loaded report but there’s no API (at the time of writing) for Shiny reports. Let’s go ahead and see what Tableau has in the pocket for us.
Tableau Integration in Liferay
As mentioned above, we will load this online public Tableau report inside a Liferay site. The other option is installing Tableau server in your environment with which you will be able to test trusted reports that is not supported by online version (currently). There are two major ways to load a Tableau report inside a web application
- Using the embedded code provided by Tableau designer. In this case interaction with Tableau server is so limited and just done by some embedded parameters inside the embedded code. The Tableau viewpoint is interactive though. In this scenario, the host application knows nothing about the report and just provides a place to Tableau server to show the reports.
- Using Tableau JavaScript API lets the user programmatically interact with the server and ask for reports. In this way, in addition to the interactive capabilities of viewpoint which let end user interact with, JavaScript API will let the host Application issues commands and control the viewpoint
As we want to have control over the Tableau report inside the Liferay Portlet, we will follow the second approach. Some controls we could have over the report in this approach are (see the official documentation for full reference):
- Access to the Toolbar Buttons: make it possible to react to the events happening in the host application or add more and composite functionalities which are not on the chart.
- GetData: Using this feature, we can get the pure data (without visualization stuff like charts) which is used in the current report. It can help to do more analyzes in the host application if needed
- Export view as an image or PDF file
- Load and Resize dynamically
- Select marks in view
- Raise several events which get lead to a reaction in the Host Application. For example, if any filter changes in the toolbar by the user, one event will be raised which can be caught by Host Application
Now think we have Tableau report hosted by Tableau server and a JavaScript API to load it in a web environment (Liferay) with many already in place capabilities to govern a module inside, like configuration, permissions and so on. Then let’s do this with Tableau report. To do this, we developed a Liferay portlet to load the report. Let’s look at some code here
<div id="<portlet:namespace/>_Viz" style="width:800px; height:700px;"></div>
<div>
    <button onclick="<portlet:namespace/>.goNextTab()">Next Tab</button>
    <button onclick="<portlet:namespace/>.getActiveTabData()">Get Data</button>
</div>
<script>
    var <portlet:namespace/> = _Tableau.create("<portlet:namespace/>_Viz", "<%=tabURL%>", {hideTabs: <%=hideTabs%>});
</script>
Above we see part of portlet view. In this example, we have two buttons located inside the Liferay portlet to have control over Tableau report. As they are part of Liferay, they can be controlled by Liferay. One more thing here is using namespaces to modularize JavaScript code for each of the portlets to avoid negative interference in case of more than one instance of this portlet on the same page. Before looking at the code, let’s talk a bit about trusted tickets to secure Tableau reports. As mentioned already currently this feature is not provided by online public Tableau servers. If you have your own Tableau server up and running, you can enable this feature. In the configuration, we can configure a trusted ticket provider to listen to some known servers like our Liferay server. Both Liferay and Tableau server get their User information from same authentication provider. A request for loading a report will go as shown in the below.
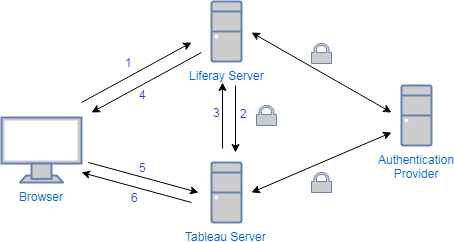
- Either at the time of loading the portlet or later, Liferay server will ask for a trusted ticket by providing the user name which is known to the Tableau server
- Tableau server will create the ticket and deliver to the Liferay server
- Using JavaScript API to load a Tableau report (or the other way to load), the ticket will be part of the request. There’s no need to send the ticket on the next interaction requests for the current report
- Tableau server will check the ticket and deliver the report to the UI
To send trusted ticket from UI to the Tableau server, we should either set with <param> tag inside the <object> tag as follows:
<param name="ticket" value= "trusted ticket" />
Or embed inside the URL looks like below when we try to load the report with JavaScript API:
URL = "http://Tableau-server/trusted/{trusted ticket}/rest-of-address";
Now let’s look at the JavaScript code for connecting from Liferay UI to Tableau Server. There are plenty of examples on the Tableau website and community on how to use its JavaScript API.
Modularize Tableau in the portlet
The following code defines a build-factory of Tableau reports inside the page. To initialize a new report in a portlet, we have to call create function of _Tableau object and pass the required arguments like URL. You can get these arguments from the portlet preferences which are configurable.
var _Tableau = (function() {
  if (_Tableau) return;

  createViz = function(containerID, url, options) {
    var _viz;
    var _id = containerID;
    var _url = url;
    var _options = options;
    var _placeholderDiv = document.getElementById(_id);
    var _workbook;
    var _default_options = {
      width: _placeholderDiv.offsetWidth,
      height: _placeholderDiv.offsetHeight,
      hideTabs: false,
      hideToolbar: false,
      onFirstInteractive: function() {
        _workbook = _viz.getWorkbook();
      }
    };
  };
  return {
    create: createViz
  };
})();
Next Tab
The following code shows how to get <Next Tab> inside the Liferay portlet works.
function _getNextSheet() {
  var activeSheet = _getActiveSheet();
  var sheets = _getSheets();
  for (var i = 0, len = sheets.length; i < len; i++) {
    if (sheets[i].getName() == activeSheet.getName()) {
      if (i + 1 < sheets.length) {
        return sheets[i + 1];
      } else {
        return sheets[0];
      }
    }
  }
}

function _switchToTab(tabName) {
  _workbook.activateSheetAsync(tabName);
}

function _nextSheet() {
  _switchToTab(_getNextSheet().getName());
}
Get Data
One of the cool features of Tableau is providing pure data of current report in a JSON format. In this example, we show the data in an alert popup. But think about all the possibilities to provide more features beyond Tableau report functionalities as soon as we have this data in the Liferay environment.
function _getUnderlyingData() {
  var sheet = _getActiveSheet();
  if (sheet.getSheetType() == "dashboard") {
    alert("This tab is a dashboard and may have more than one sheet!");
    return;
  }
  options = {
    maxRows: 0, // Max rows to return. Use 0 to return all rows
    ignoreAliases: false,
    ignoreSelection: true,
    includeAllColumns: false
  };

  sheet.getUnderlyingDataAsync(options).then(function(t) {
    var table = t;
    alert(JSON.stringify(table.getData()));
  });
}
And this list can get longer by your custom requirements.
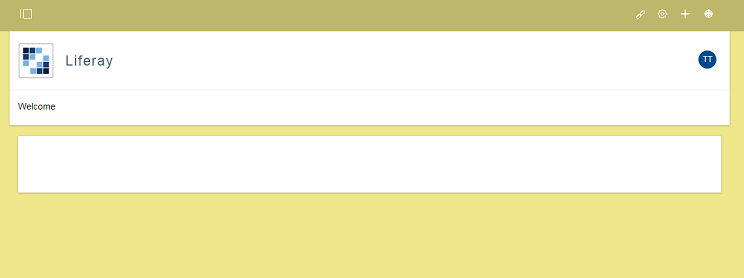
Now let’s load Tableau reports in our Liferay instance using a custom portlet. What we have now is an empty page in a Liferay site named “Liferay”
Now we add a Tableau report using a custom portlet. Drag the Tableau integration portlet inside the page
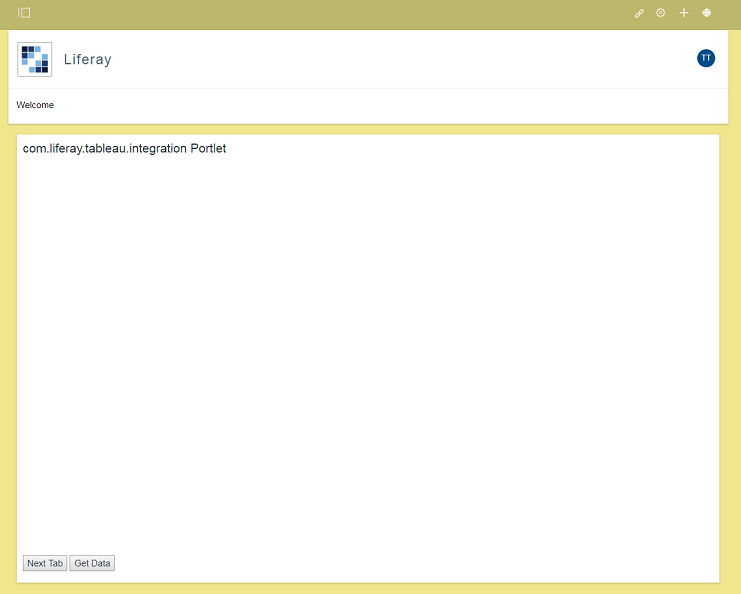
This portlet will host the Tableau report. Its report section is empty, but we can see the control buttons below. Let’s use Liferay preferences for this portlet and load a report from this public URL: https://public.tableau.com/views/WorldIndicators/GDPpercapita
To do so, open the portlet configuration and add the URL. We can do some other configurations like hiding report tabs and so on. In Addition, have the opportunity to add additional preferences to our portlet if we want (using the publicly available code from GitHub).
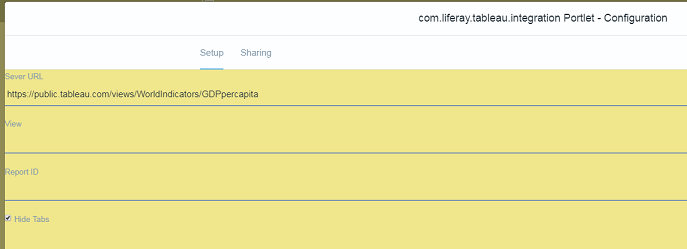
We added the report URL and command to hide report tabs (this report in Tableau server has several tabs). After saving the preferences, the report will be loaded by the JavaScript API.
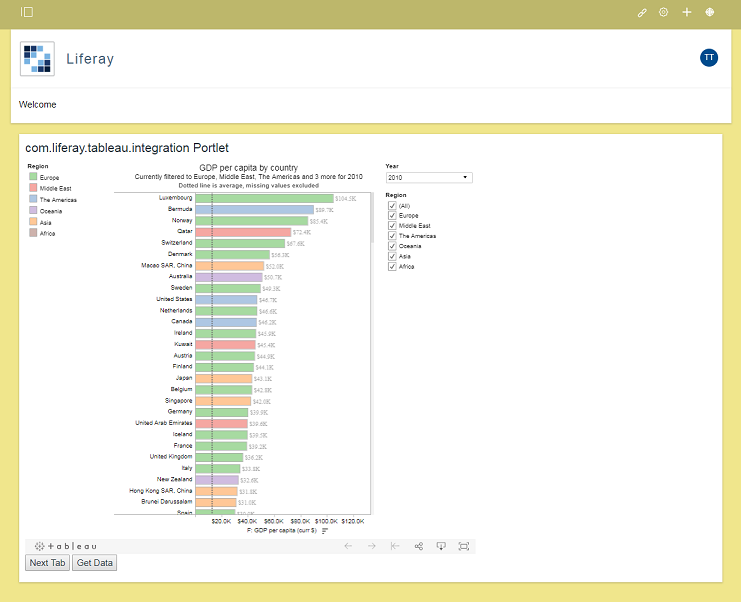
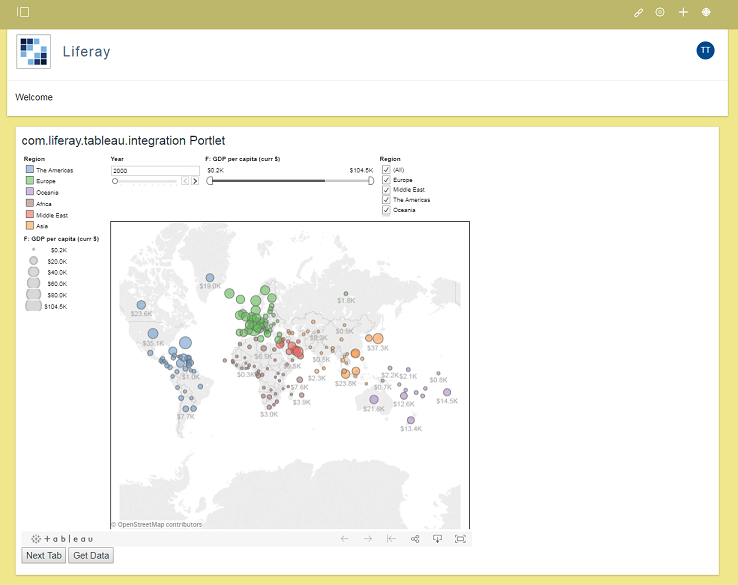
Apart from the interactive part of the Tableau report, we have controls over the same report from Liferay in two ways; first from preferences and second with buttons below the portlet. Push the <Next Tab> button and navigate to the next tab.
This was a step-by-step introduction to loading a Tableau report in Liferay. With these capabilities you have a lot of control over the Tableau report directly from Liferay. You can use this to adjust the custom Tableau integration portlet to your needs. We will discuss the Shiny integration into Liferay in an upcoming blog post so keep an eye on the mimacom blog! You can find source code for this blog post here on GitHub