Time Travel Debugging
Do you have a flaky test showing up rarely? Do you sometimes skip to the next breakpoint too early and must restart? Do you sometimes wish you could see what your application state was 1 second ago? Or do you sometimes wish you could see who has modified a field of a class just before "now"?
If the answer is yes to some of these questions, then this blog post might be for you!
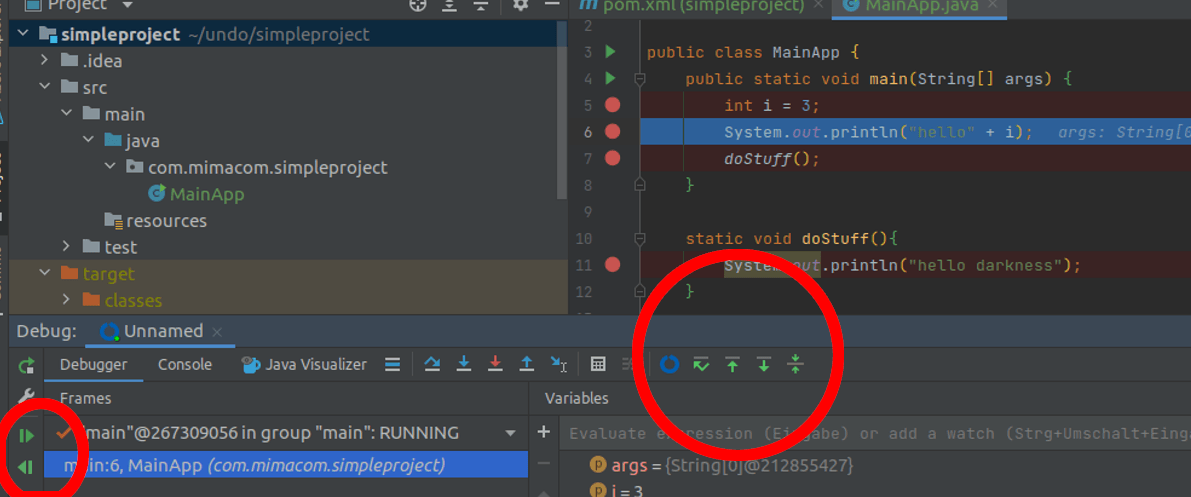
As a small primer: see the following new buttons in your debug view:
A few weeks ago I wanted to learn some new technology stacks. For that I brewed my coffee, sat down in front of my PC and... did not learn. At least not, what I initially decided to do. I have started the PC, WSL2, IntelliJ Idea, Docker and was almost there.
But instead of programming I've opened up the plugins window. While browsing not only 10 minutes, or 30 minutes, I've spent at least one hour scrolling through the plethora of plugins.
And there I've seen it. Time Travel Debugging. As a Plugin. Huh, what's that?

Why have I never heard about time travel debugging? Chats with colleagues have sparked their interest, too. The videos of undo.io explaining what their tool does, that looks like a feature too good to be true.
The Goal Of This Blogpost
- We'll build a pipeline with failsafe, jacoco and live-recorder, recording test-failures.
- I'll show some errors I've encountered at the end of the blogpost, because that is some major point I missed while exploring the plugin / tool.
Table of Contents
- Prerequisites
- What Is Time Travel Debugging
- What Is Live Recorder
- What Is Live Replay
- Most Prominent Features Of Live Recorder
- How To Use Live Recorder
- While Normally Debugging
- Manually Recording A Test (so you could share the problem with your colleagues)
- As A Recorder For Failing Tests In Combination With Jacoco
- Problems Faced With Live Recorder
- The Drawbacks
- Conclusion
Prerequisites
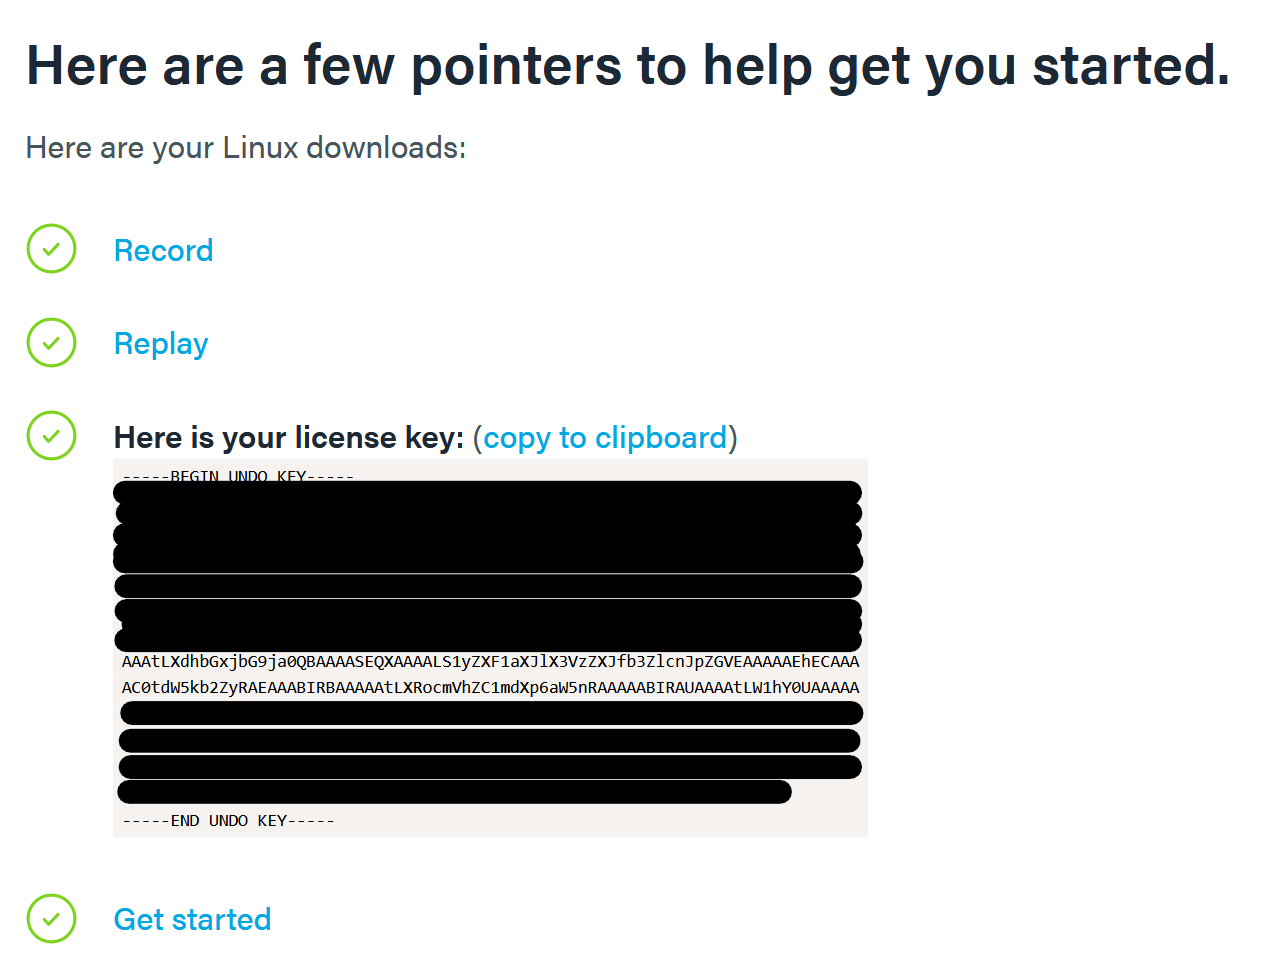
- A trial license for live-recorder is required undo.io/getjava
- JDK 11 (I'm using azul zulu) - (JDK 17 did not work)
- IntelliJ IDEA 2021.3.* (IDEA 2022.* did not work)
- Ubuntu / Linux machine (WSL2 did not work)
- A sample project, you wish to time travel debug
What Is Time Travel Debugging
It's quite simple: you can jump back in time. Jump back to the breakpoints before, including the application state at this point in time.
Such a technical answer, as I've stated at the very top of this post, there are some cool goals you can reach:
- catch that one flaky test and how the test suite ended there
- rewind to the breakpoint before
- see who has modified a field before this call
- just add new breakpoints
- explore the codebase and how everything is tied together
What Is Live Recorder
Live Recorder is a tool created by undo.io. Attached to your Java Application as an agent it'll record the JVM state into a file with the postfix filename.undo.
What Is Live Replay
Live Replay comes with Live Recorder. It's an additional application which loads your recording file. Also, a port is opened, by default port 9000. Finally, you attach IntelliJ Idea to this port and start debugging forwards and backwards.
Most prominent Features of Live Recorder.
There seems to be 3 major use-cases:
- Debug an application, as you would normally, just with the ability to jump back in time.
- Remotely debug an application, also with the ability to jump back in time
- Replay a recording by attaching IntelliJ to a started Live Replay session
How to use Live Recorder
Let's dive into this topic, but first let's download all the required tools and obtain the information.
- Register for a trial: undo.io/getjava
- Wait for the confirmation mail with the link to the resources

- download the RECORD and the REPLAY tool
- unzip the data
unzip LR4J-Record-6.7.1.zip -d record
export record_dir="$(pwd)/record"
unzip LR4J-Replay-6.7.1.zip -d replay
export replay_dir="$(pwd)/replay"
- Install IntelliJ Idea 2021.3.* IntelliJ other Versions
- Install the Time Travel Debugging Tool in IntelliJ
- Configure the Plugin:
- Open the Settings "Build, Execution, Deployment > Debugger > LiveRecorder"
- paste your license key, and set the live replay path (
echo $replay_dir)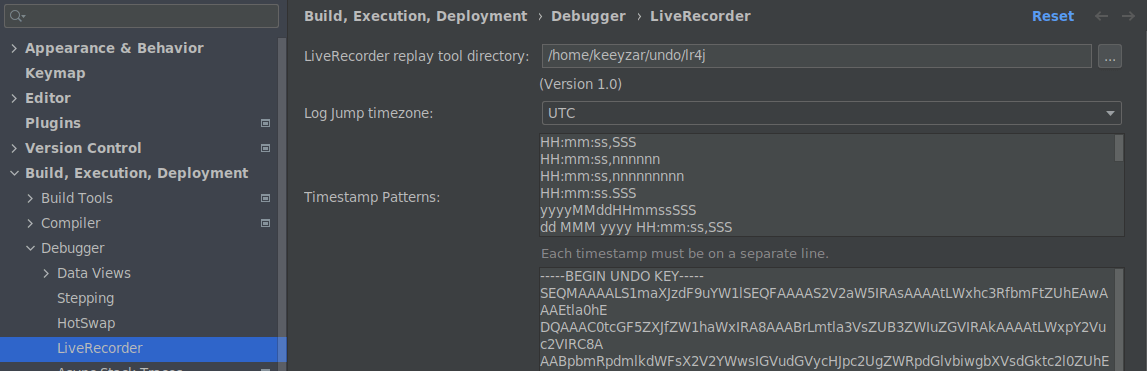
- Create a new Maven Project, or use an existing application using maven
- !!IMPORTANT!! Make sure, that the JAVA_HOME variable points to the same version you run your project (compare "Project Settings" JDK with javac --version)
Now we're set up. Let's debug our first application:
How to use Live Recorder While Debugging Normally
Let's simply debug an application as we've done it a million times already
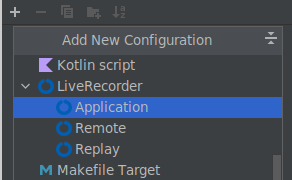
- Create a new Run Configuration
- select your main class (for example @SpringBootApplication annotated class)
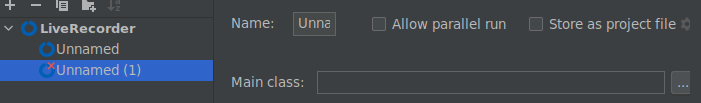
- if you see the following error in the run configuration:
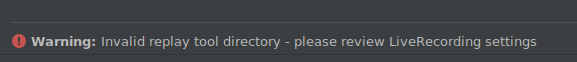
then go back to the above chapter and configure the LiveRecorder Path correctly - Press debug. After some seconds the application should start, and you should see
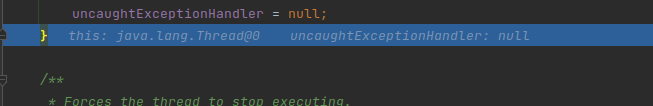
a view as in the following image:
How To Manually Record And Replay A Test
Recording the application is as simple as adding some JVM Arguments to the execution of the application. Better said: we need to pass an agent to the VM.
- create a simple test
- run the test once
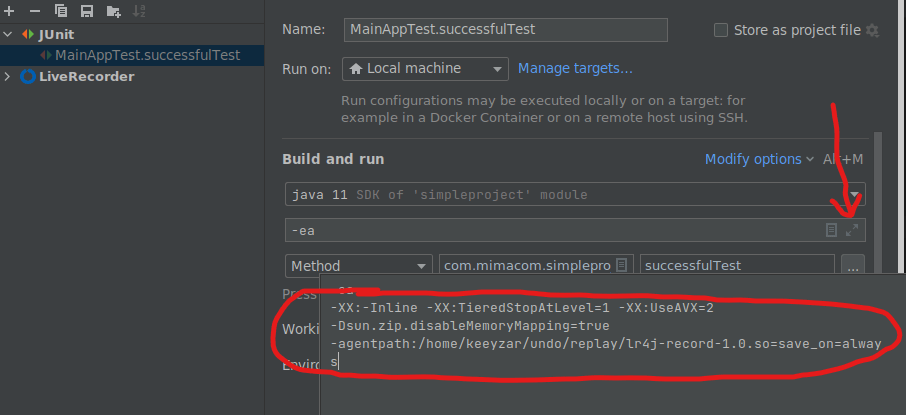
- edit the run configuration for the test
- add VM Arguments to the run configuration: (if not visible, make VM Argument input field visible first)
-XX:-Inline -XX:TieredStopAtLevel=1 -XX:UseAVX=2 -Dsun.zip.disableMemoryMapping=true -agentpath:/home/keeyzar/undo/lr4j-record-1.0.so=save_on=always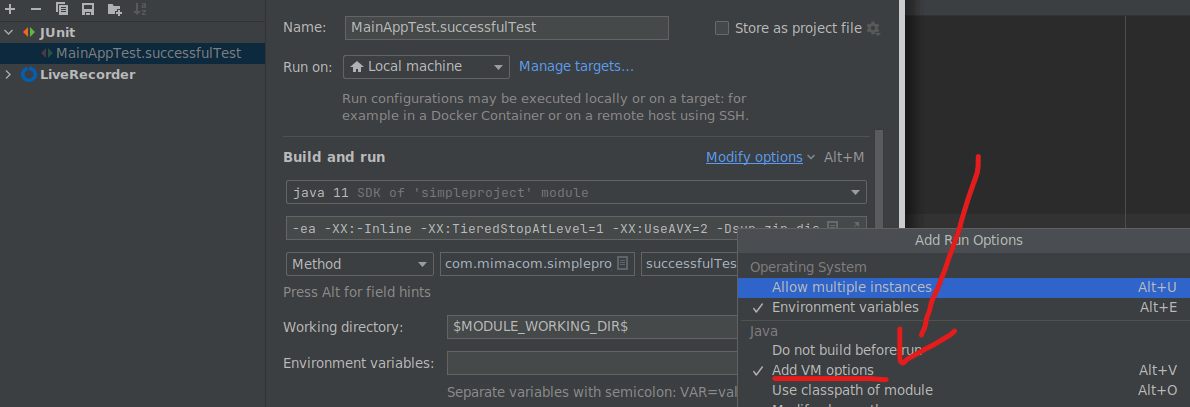
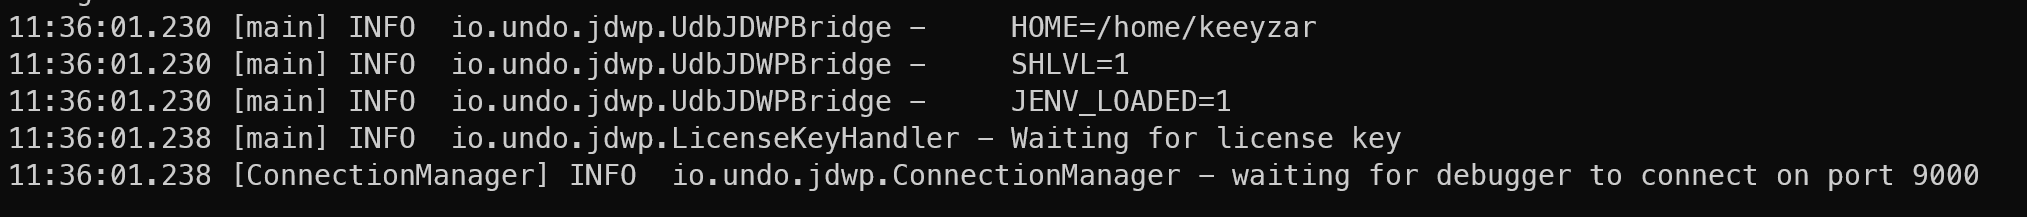
- run the test again, you should now see a file with a timestamp:
Now that we've recorded the test, let's replay it.
- add some breakpoints to your test
- rename the file for ease of use to
first-recording.undo - now start the live replay server via console
cd $replay_dir
path_to_project=/path/to/your/project/root/dir #where pom is located
./lr4j/lr4j_replay -i $path_to_project/first-recording.undo -cp $path_to_project/target/test-classes
- you should see, that the replay application is ready to accept connections on port 9000
 There is much more output, mostly debug, e.g. which java version is used.
but the last line should look like this
There is much more output, mostly debug, e.g. which java version is used.
but the last line should look like this
- In IntelliJ Idea create a new run configuration
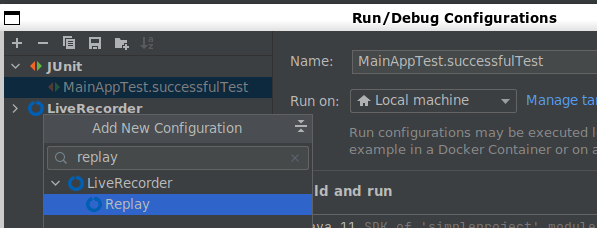
- add
localhostto the run configuration, nothing else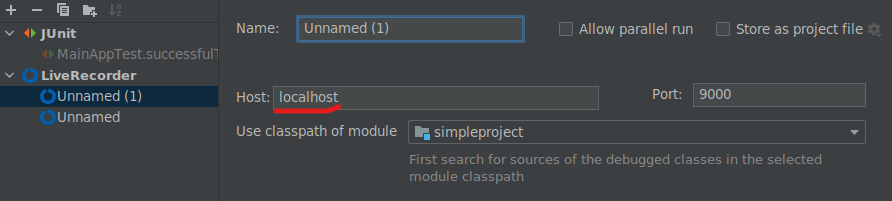
- press the debug button
Some Additional Information:
- IntelliJ froze multiple times, you can kill the lr4j_replay application with
ctrl-c, which should give you back your control.
Let's go to the last step, where we stitch everything together - integrating Live Recorder into our CI/CD
Record Failing Tests with Surefire and Jacoco
Integrating Live Recording with failing tests in Surefire is described in the documentation , but there are some problems around surefire / failsafe with the argLine. The problem with jacoco/surefire/failsafe can be found here http://www.devll.org/blog/2020/java/jacoco-argline.html Also, the documentation of undo.io is stuck on JUnit 4. I'll show you how to transfer the Rule to the JUnit 5 equivalent.
The following code excerpt is a minimum example for jacoco + surefire + junit 5.
<?xml version="1.0" encoding="UTF-8"?>
<project xmlns="http://maven.apache.org/POM/4.0.0"
         xmlns:xsi="http://www.w3.org/2001/XMLSchema-instance"
         xsi:schemaLocation="http://maven.apache.org/POM/4.0.0 http://maven.apache.org/xsd/maven-4.0.0.xsd">
    <modelVersion>4.0.0</modelVersion>

    <groupId>com.mimacom</groupId>
    <artifactId>simpleproject</artifactId>
    <version>1.0-SNAPSHOT</version>

    <properties>
        <maven.compiler.source>11</maven.compiler.source>
        <maven.compiler.target>11</maven.compiler.target>
        <junit-jupiter-engine.version>5.8.2</junit-jupiter-engine.version>
        <maven-surefire-plugin.version>3.0.0-M6</maven-surefire-plugin.version>
        <jacoco.ut.execution.data.file>${project.build.directory}/coveragereport/jacoco-ut.exec</jacoco.ut.execution.data.file>
        <surefireExtraArgs/>
    </properties>

    <dependencies>
        <dependency>
            <groupId>org.junit.jupiter</groupId>
            <artifactId>junit-jupiter-engine</artifactId>
            <version>${junit-jupiter-engine.version}</version>
            <scope>test</scope>
        </dependency>
    </dependencies>

    <build>
        <plugins>
            <plugin>
                <groupId>org.apache.maven.plugins</groupId>
                <artifactId>maven-surefire-plugin</artifactId>
                <version>${maven-surefire-plugin.version}</version>
                <configuration>
<!--                    forCount etc. is because otherwise we have multiple failed tests in the same recording.. bad.-->
                    <forkCount>1</forkCount>
                    <reuseForks>false</reuseForks>
                    <skipAfterFailureCount>1</skipAfterFailureCount>
<!--                    1. we need the normal surefireArgLine, but also we might append some args via console (extra args)
                        these args normally are empty, therefore we have an empty property declared above, so that
                        surefire does not throw an exception.

                        2. we need to pass the agent information to surefire, so that it's creating new JVMs with the
                        record agent

                        3. we instruct the agent to record only if there is a failure.
                        but we also need to tell WHEN a failure happened... this is described after this xml file

                        !!!MAKE SURE TO CHANGE THE PATH OF THE RECORD APPLICATION IN THE FOLLOWING LINE!!!
-->
                    <argLine>@{surefireArgLine} ${surefireExtraArgs} -XX:-Inline -XX:TieredStopAtLevel=1 -XX:UseAVX=2 -Dsun.zip.disableMemoryMapping=true -agentpath:/path/to/your/record/lr4j-record-1.0.so=save_on=failure</argLine>
                </configuration>
            </plugin>

            <plugin>
                <groupId>org.jacoco</groupId>
                <artifactId>jacoco-maven-plugin</artifactId>
                <version>0.8.4</version>
                <configuration>
                    <haltOnFailure>false</haltOnFailure>
                </configuration>
                <executions>
                    <execution>
                        <id>pre-unit-test</id>
                        <goals>
                            <goal>prepare-agent</goal>
                        </goals>
                        <configuration>
                            <destFile>${jacoco.ut.execution.data.file}</destFile>
                            <propertyName>surefireArgLine</propertyName>
                        </configuration>
                    </execution>
                    <execution>
                        <id>post-unit-test</id>
                        <phase>test</phase>
                        <goals>
                            <goal>report</goal>
                        </goals>
                        <configuration>
                            <dataFile>${jacoco.ut.execution.data.file}</dataFile>
                            <outputDirectory>${project.reporting.outputDirectory}/jacoco-ut</outputDirectory>
                        </configuration>
                    </execution>
                </executions>
            </plugin>
        </plugins>
    </build>
</project>
Now that we have configured the pom with the required dependencies but also with the correct surefire argLine we can proceed with configuring the last step: Setting environment variables for the agent, so that the agent knows when to save the recording and when not:
- create the following Listener for your JUnit Tests:
    public class ReplayInstructorExtension implements TestWatcher, BeforeEachCallback {
        //tell the agent, how we want the recording to be named
        //this method is from the BeforeEachCallback
        @Override
        public void beforeEach(ExtensionContext context) throws Exception {
            System.setProperty("io.undo.output", context.getDisplayName());
        }

        //method is from TestWatcher interface. We need to tell
        //the recorder, that it should save the recording
        @Override
        public void testFailed(ExtensionContext context, Throwable cause) {
            // Tell LiveRecorder that the test failed
            System.setProperty("io.undo.failed", "true");
        }
    }
- add an Extension Hook to your test class:
@ExtendWith(value = ReplayInstructorExtension.class)
class MainAppTest {

    @Test
    void successfulTest() {
        System.out.println("hi");
        Assertions.assertEquals(1, 1);
    }

    @Test
    void failingTest() {
        System.out.println("bye");
        Assertions.assertEquals(1,2);
    }

    @Test
    void anotherFailingTest() {
        System.out.println("bye");
        Assertions.assertEquals(1,2);
    }
}
- run your tests with
mvn clean verify - after the execution you should see two files: "failingTest.undo" and "anotherFailingTest.undo"
- if you disable the failing tests, you should see the coverage reports from jacoco.
- Success. You have integrated Jacoco & Time Travel Debugging in your CI Pipeline
Congratulations, you've successfully automated the recording of your failing tests. Partly at least.
Problems faced with Live Recorder
I had a lot of errors and nearly stopped evaluating the tool. Let me shortly explain why: There is no clear indication what does not work. There are some errors not clearly stating what's wrong. The application just freezes IntelliJ and I need to either restart or find some other way.
Also, sometimes it looked like it's working, but it didn't. Trying to find out what's going on.
On my journey I've
- switched from Spring Boot to a simple Project
- from JDK 17 to JDK 11
- from IntelliJ Idea 2022.* to Idea 2021.3.*
- from WSL2 to another pc running Ubuntu locally
- encountered further problems, e.g. missing debug symbols in the default openjdk
before I even saw that the tool can do, what it's promising. All that while always getting multiple freezes. This was really discouraging.
If you see one of the following problems, you might need to change your environment, also:
- Constantly freezing IntelliJ Idea, when clicking in the UI (wrong JDK + wrong IntelliJ Idea version):

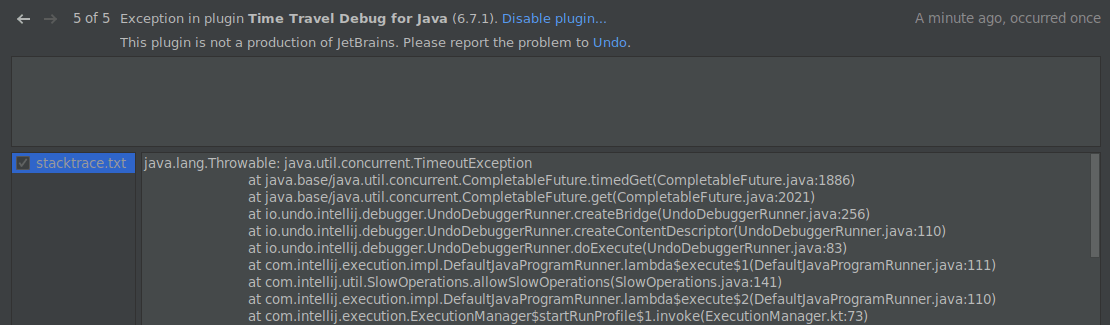
- Wrong JDK - difference in JDK while recording and replaying:
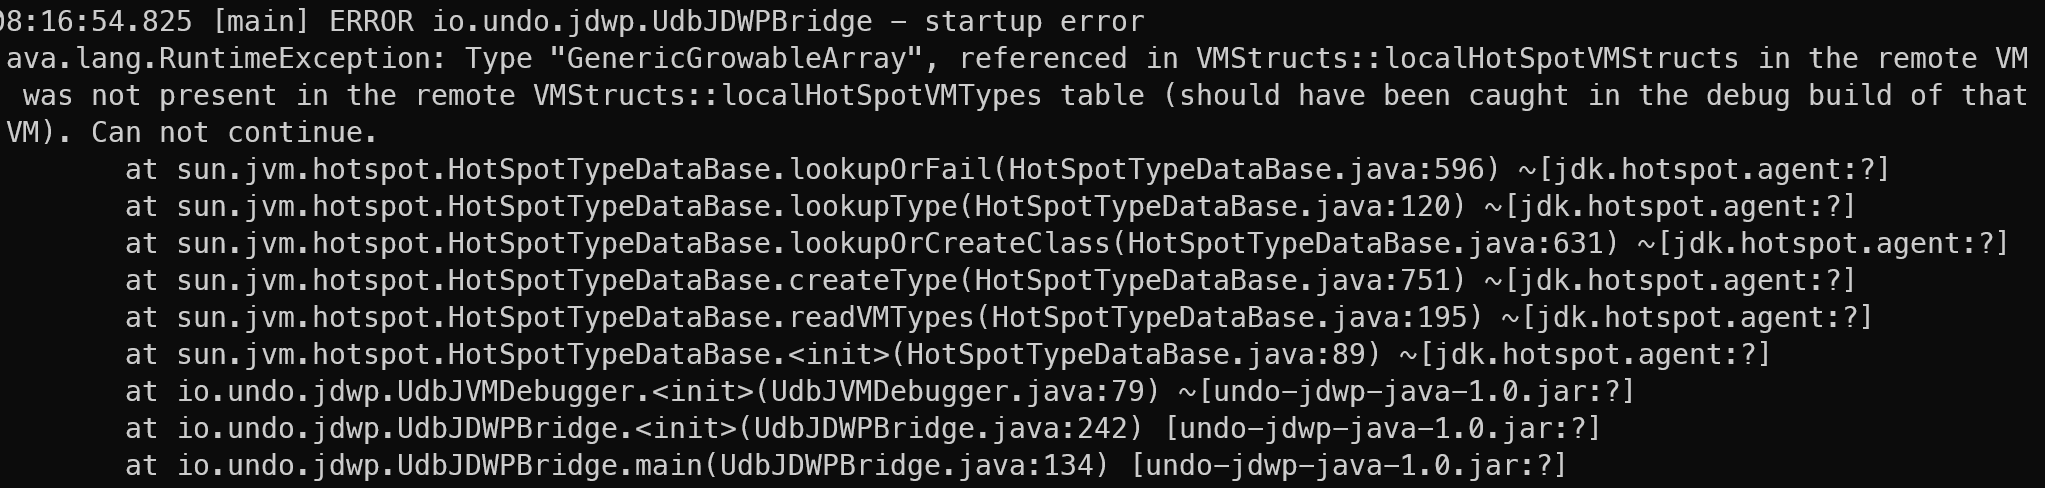
- exceptions thrown within IntelliJ Idea (wrong JDK + wrong IntelliJ Idea version):
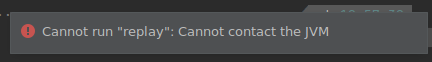
- if you have not started the replay application first, when starting the replay run configuration:
- freezing, when setting a breakpoint, when having the wrong JDK and/or IntelliJ Idea:
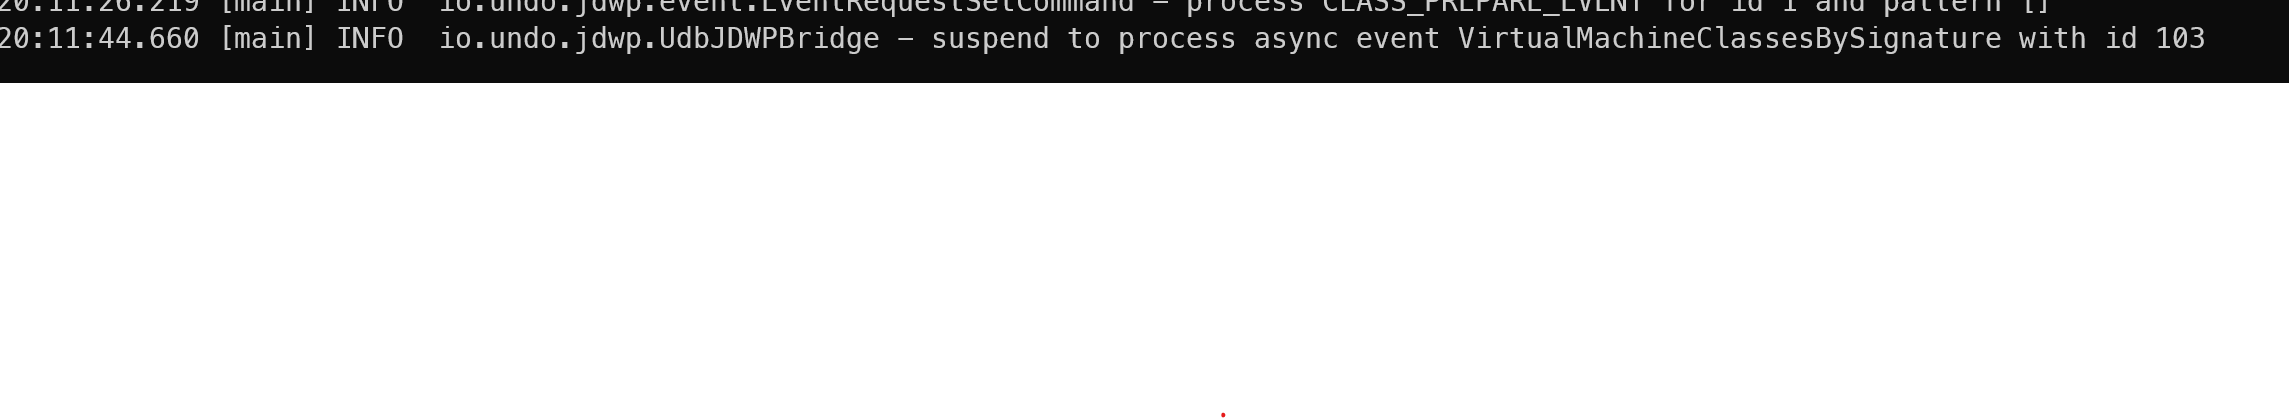
- stopping at non-existing breakpoints, hinting the program/setup works, but actually not:
With these exceptions you're just faced with: it's not working, and I don't know why. Good luck googling these issues!
The Drawbacks
Let's wrap this topic up with annoyances I've encountered on my way.
- The pricing is not public.
- There is no section with common errors in their documentation. And let me tell you, I've encountered a lot of errors.
- I did not find any resources except the official ones. I assume that this is the lack of an existing community / users behind the product.
Conclusion
Time Travel Debugging is another mighty tool in our developer tool belt. It's still rough on some edges, but if configured correctly, it might save you a lot of time debugging. Also - as learned in my bachelors told by one of my professors:
'you can have the best product. If no-one knows that your product exists, it won´t succeed'